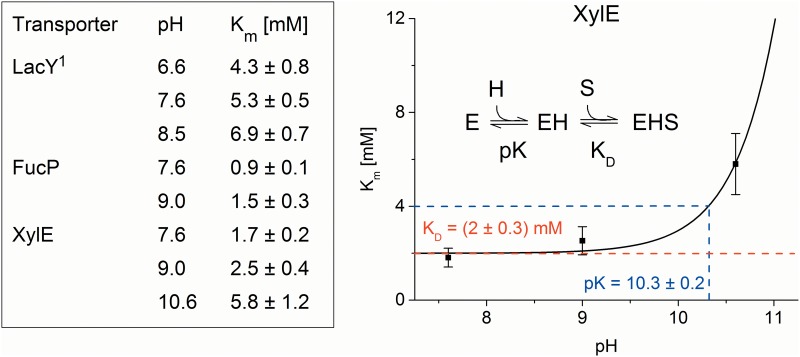
Fig 2. pH dependence of Km values.
Table: Km values at different pH for the main substrates α-D-Lactose, L-Fucose and D-Xylose of LacY, FucP and XylE, respectively determined from a hyperbolic fit to the peak currents as shown in Fig 1. 1Data from [31]. Graph: pH dependence of Km for XylE. The line is a fit to the data using a model function for sequential H+—sugar binding as indicated in the figure.

