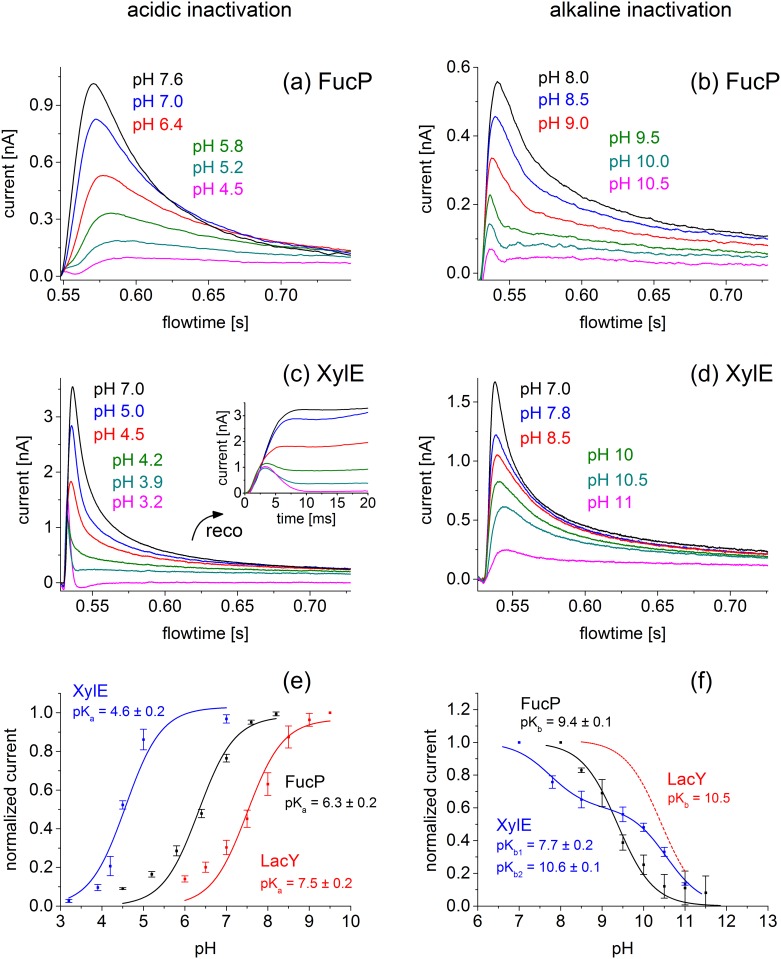
Fig 3. pH dependence of peak currents for LacY, FucP and XylE in the acidic (left) and basic (right) pH range.
(a, b) Transient currents obtained with FucP proteoliposomes after a 30 mM L-Fucose concentration jump in the acidic pH range using the low time resolutions set up (a) and in the basic pH range using the high time resolution set up (b). (c, d) Transient currents obtained with XylE proteoliposomes after a 30 mM D-Xylose concentration jump in the acidic pH range (c) and the basic pH range (d) using the high time resolution set up. The inset of (c) shows reconstruction of the symporter currents using circuit analysis (see Text). Note that the different peak currents for the same pH values in (a) and (b) as well as (c) and (d) is a result of different amounts of proteoliposomes adsorbed to the sensor. Acidic and alakaline inactivatation was measured on different sensors.(e,f) Peak currents and determination of pK values for LacY (red), FucP (black) and XylE (blue) proteoliposomes after a sugar concentration jump of 100 mM alpha-D-Lactose, 30 mM L-Fucose and 30 mM D-Xylose, respectively. For comparison transient currents for LacY were determined using the low time resolution set up (data not shown) and average peak currents are included. The solid line is a fit to the data using a titration function as described in Materials and Methods. Experimental conditions as described in panel e. The deviation of the data points from the fitting curve under extreme pH conditions for LacY and FucP is possibly due to the increasing influence of presteady state components.

