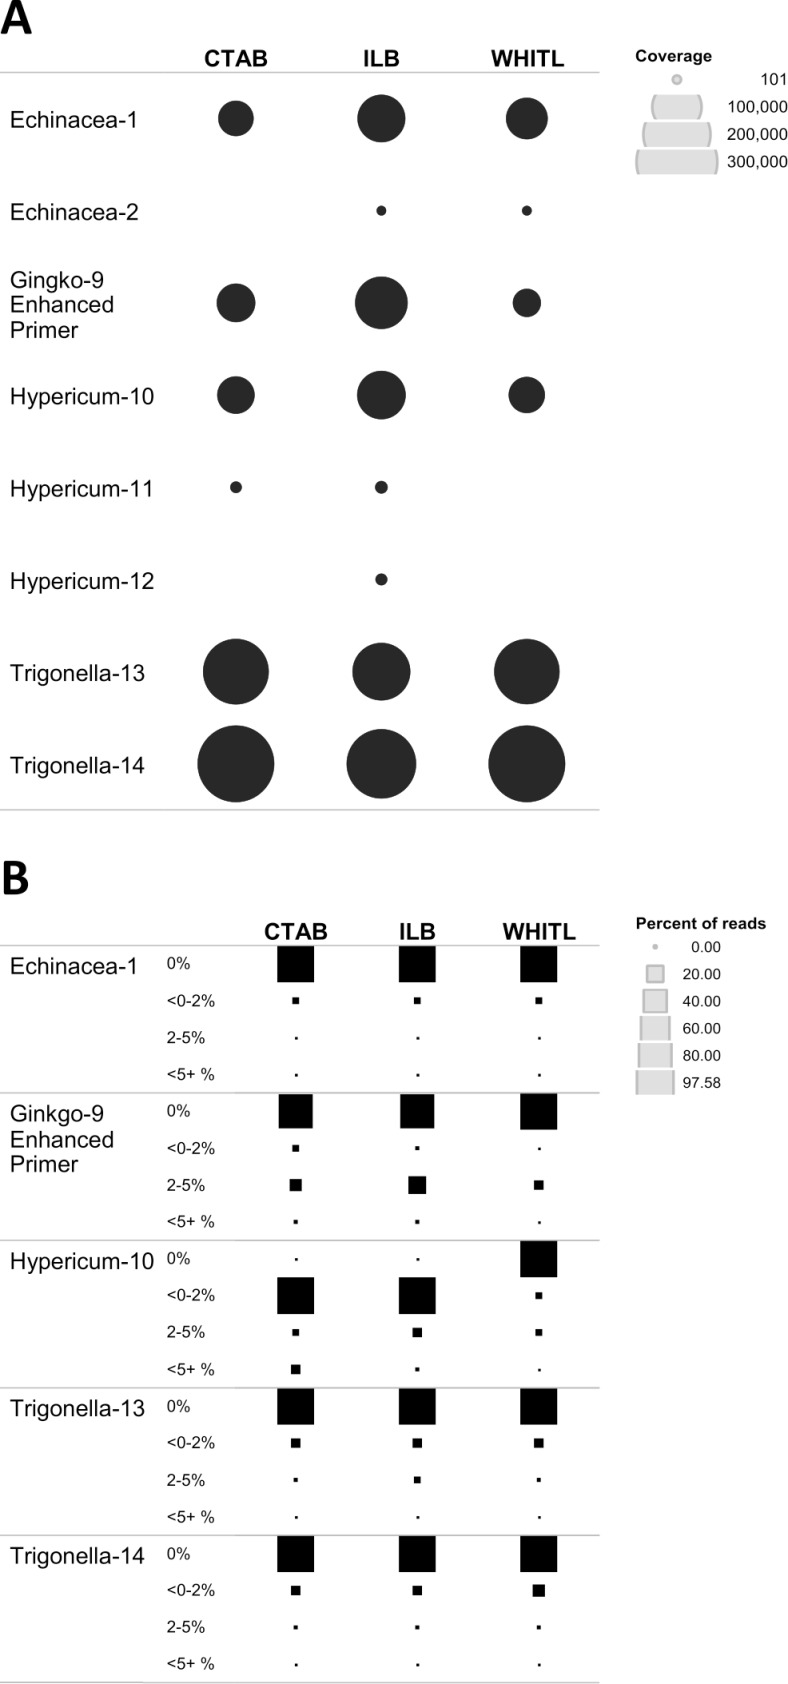
Fig 2. Listed DNA recovery.
(A) Summary of target DNA detection with NGS, using custom ITS database for plant and fungi downloaded from Genbank. Coverage for ITS2 is indicated by circle size. (B) Quality of read clusters (OTUs) for five supplements with significant amplification of target DNA. Size of the square reflects percentage of reads falling within a distance threshold of 0%, <0–2%, 2–5%, and <5% from the reference library sequences.

