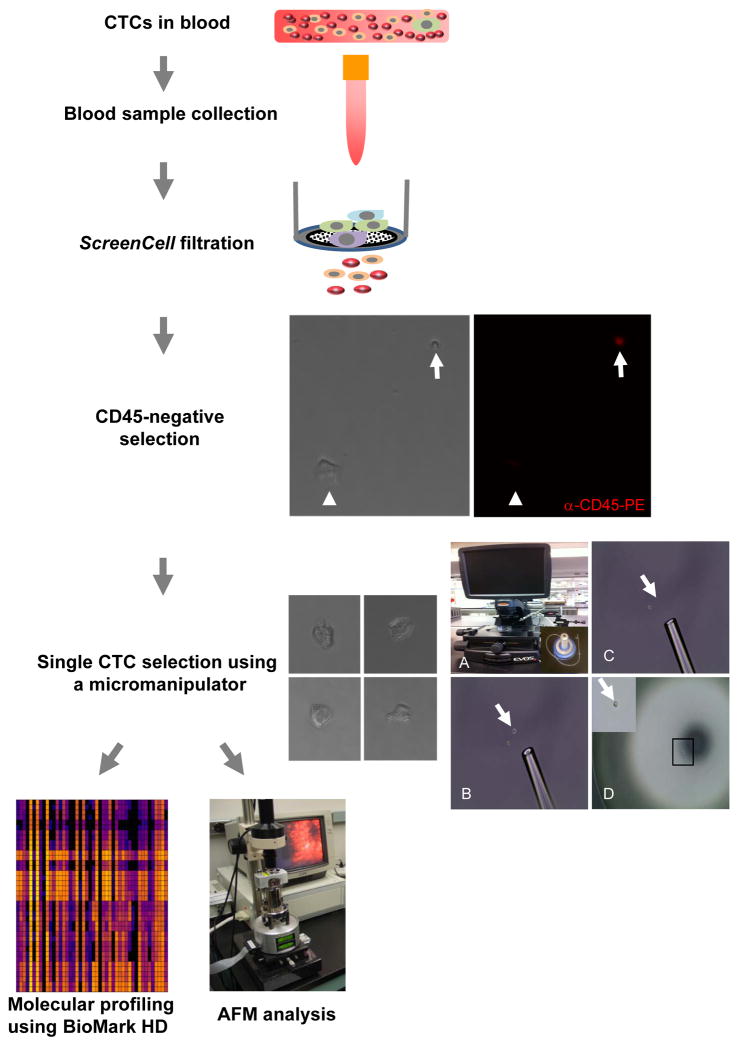
Fig. 1.
A schematic flow chart of CTC isolation and analyses. The details are described in the Materials and Methods section. In anti-CD45 negative selection, representative microscopic photos show a CTC (white arrow head) was negative for anti-CD45-PE staining, whereas a blood cell (white arrow) positive. In single CTC selection, the left panel shows four representative CTCs and the right panel illustrates the single cell isolation using a micromanipulator and an Evos fl microscope. A: An Evos fl microscope and a micromanipulator (inset). B: A pipette tip pointing to a cell (white arrow) selected using a micromanipulator. C: The single cell was aspirated into the pipette tip from the place it was previously located at (white arrow). D: The selected single cell was placed on a petri dish. A higher magnification of the single cell (black rectangle) is shown in the inset.

