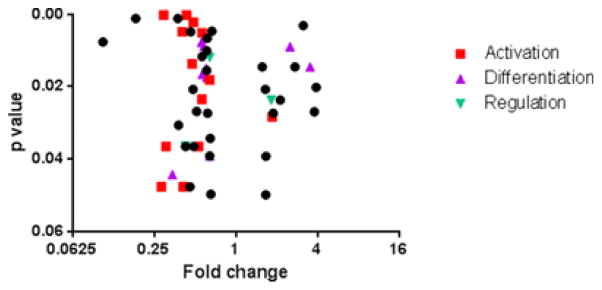
Figure 4. Effects of teplizumab on gene expression in CD8CM T cells, measured by nanostring, from teplizumab-treated responders, non-responders, and placebo-treated subjects after treatment.
Volcano plot of a comparison of gene expression in CD8CM T cells in drug-treated responders (n=6) vs drug-treated non-responders (n=3) and placebo treated (n=6) subjects. The log2 of the fold change (X-axis) and p value are plotted. Differences in gene expression of at least 1.5-fold with a p<0.05 (Wilcoxon Rank Sum test) are shown. Genes that are associated with T cell activation, differentiation, and regulation are shown. A listing of data of the individual genes is shown in Table 2.

