
Fig. 3.
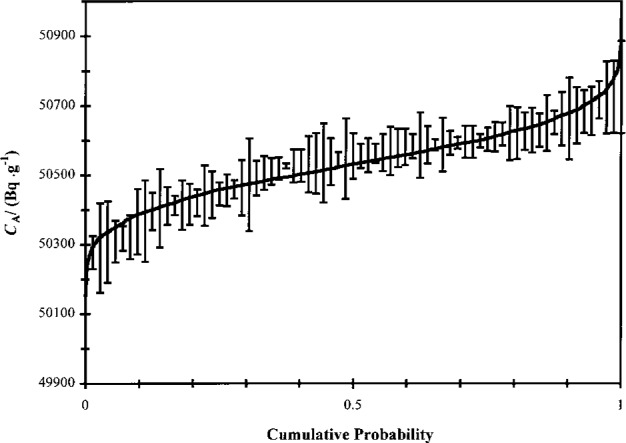
Cumulative probability plot for the data obtained in the present calibration experiments. The uncertainty bars indicate the standard deviation of measurement repeatability for three to seven measurements on a single LS cocktail. The solid line represents random values drawn from a normal distribution with mean μ = 50.534 kBq ·g−1 and standard deviation σ = 0.113 kBq · g−1.