
Fig. 8.
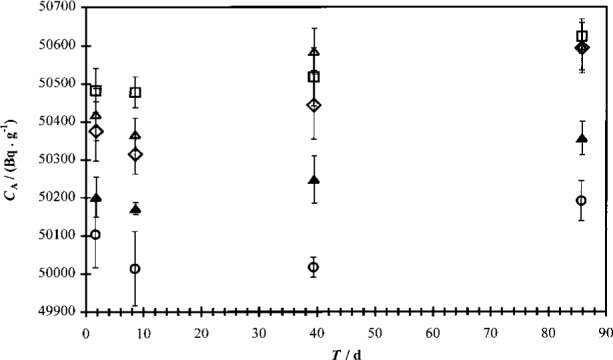
Plot of efficiency-traced massic activity CA (in Bq · g−1) for 63Ni (ampoule 30, Experiments “A” to “D”) as a function of the time T (in d) between LS cocktail preparation and median of count interval of five 20 min cycles. The uncertainty bars denote the one standard uncertainty interval for measurement repeatability across five cycles. The aqueous fraction f of the total cocktail mass was 0.001 in Ready Safe. Data were acquired on the Beckman spectrometer. The data series are denoted “R1” to “R5” (circles, squares, triangles, diamonds, and filled triangles, respectively), where “R1” is the least-quenched cocktail.