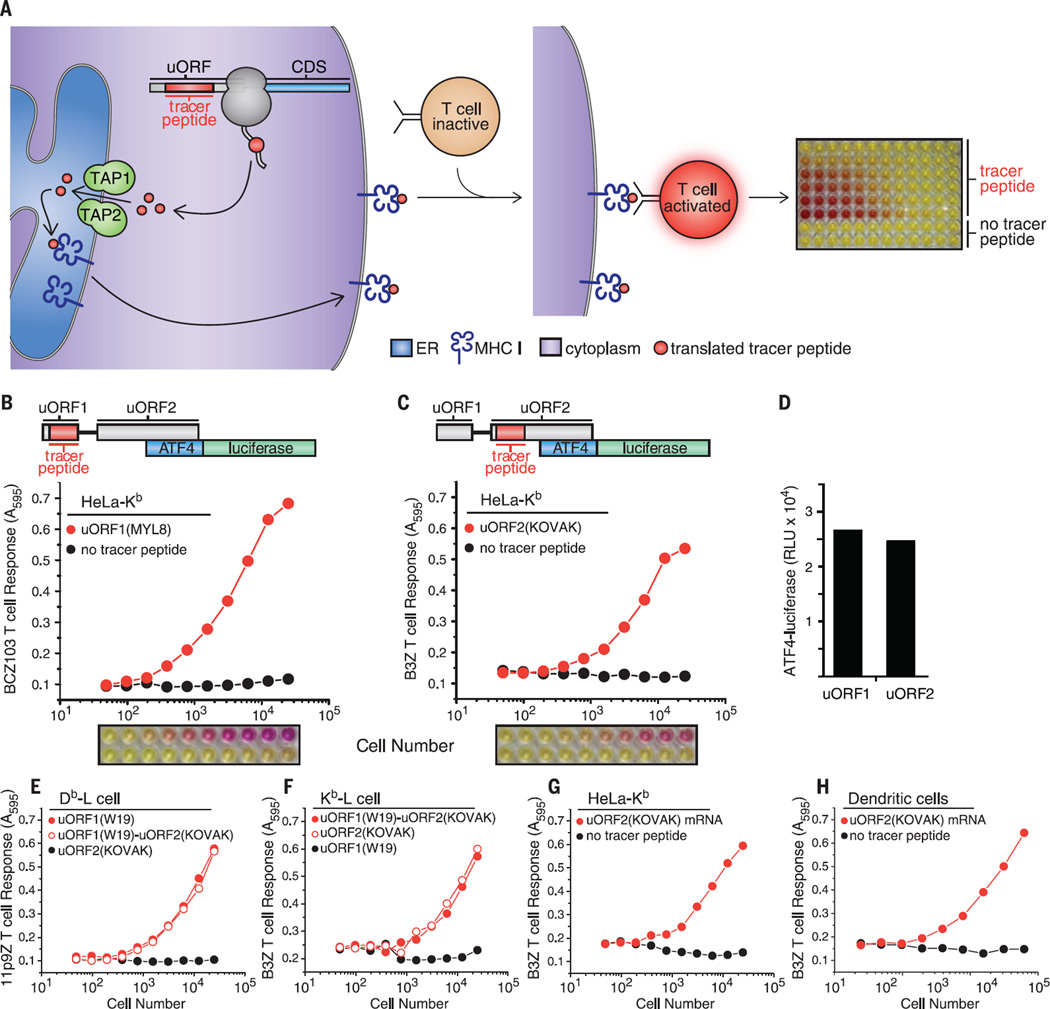
Fig. 1. 3T reveals the translational capacity of uORFs in 5′ UTRs.
(A) Schematic of 3T: A tracer peptide inserted into noncoding regions of the 5′ UTR, such as uORFs, followed by translation, peptide processing, and transport by TAP into the ER for loading onto MHC I molecules. The tracer peptide–MHC I complex transits to the cell surface and is recognized by a T cell hybridoma. Recognition of the tracer peptide–MHC I complex on the cell surface activates the T cell hybridoma, which is measured by a colorimetric assay and indicates the presence of a uORF translation product. Schematics of the ATF4 5′ UTR with nested tracer peptides. Plotted T cell responses and colorimetric readout of the 3Tassay from tracer peptides generated from transfection of HeLa-Kb cells with (B) uORF1(MYL8)–ATF4-luciferase detected with the BCZ103 T cell hybridoma and (C) uORF2(KOVAK)–ATF4-luciferase detected with the B3Z T cell hybridoma with simultaneous detection of ATF4-luciferase expression (D). T cell responses from tracer peptides generated from uORF1(WI9)–ATF4-luciferase, uORF1 (WI9)-uORF2(KOVAK)–ATF4-luciferase, or uORF2(KOVAK)–ATF4-luciferase transfected (E) Db-L cells detected with the 11p9Z T cell hybridoma or (F) Kb-L cells detected with the B3Z T cell hybridoma. 3T responses from uORF2(KOVAK)–ATF4-luciferase (detected with the B3Z T cell hybridoma) generated from mRNA transfection of HeLa-Kb cells (G) and primary bone marrow–derived dendritic cells (H). T cell responses are representative of n ≥ 3. A595, absorption at 595 nm.

