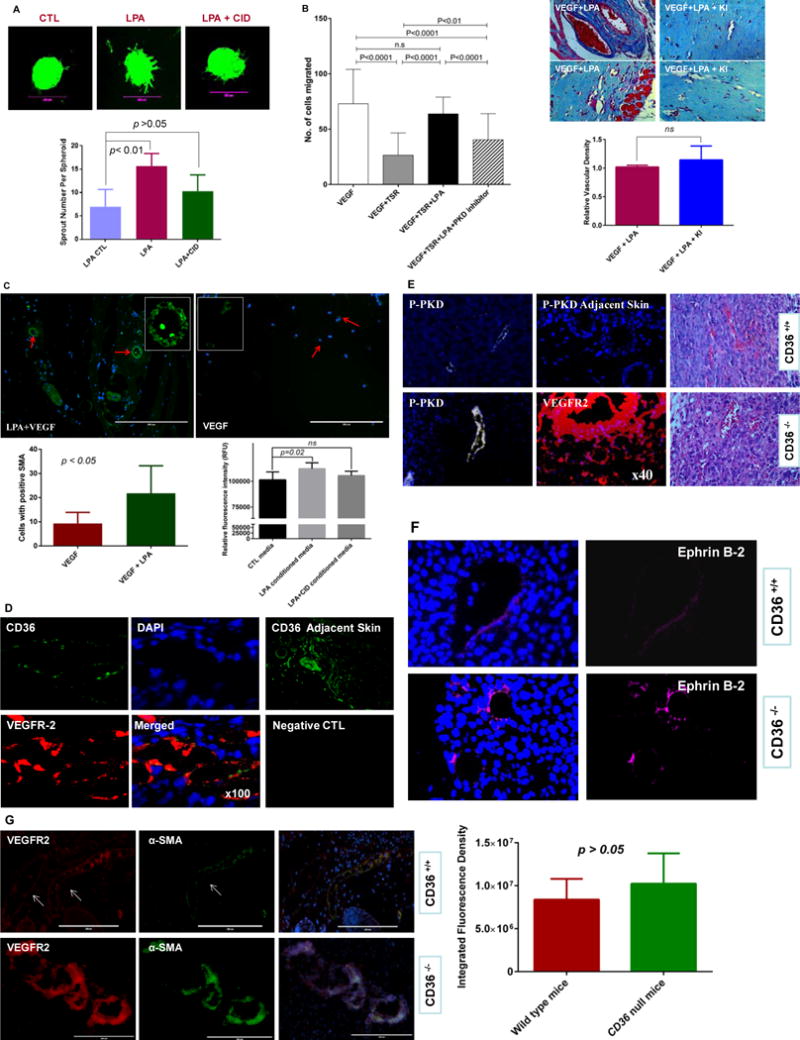
Figure 6. PKD-1 signaling promotes proangiogenic and proarteriogenic responses.

A, PKD-1 signaling is associated with LPA-stimulated sprouting morphogenesis in primary MHECs. MHECs were exposed to LPA and used in a three-dimensional spheroid assay. LPA (10 μM) was added to the media for 48 hrs to induce branching morphogenesis, and a selective PKD inhibitor CID755673 (25 μmol/L) was added in a group with LPA treatment with vehicle as control. Branching morphogenesis was observed under fluorescence microscope and pictures were taken with a digital camera linked to MetaMorph® 7.0 software and representative pictures are shown, and scale bar is 200 μm (upper panel). Sprouting described in B was quantified microscopically by counting sprouts per spheroid at 48 hrs in response to LPA (lower panel). B, LPA inhibition of TSR-induced inhibition of vascular invasion is partially dependent on PKD-1 signaling. Matrigel plugs mixed with a combination of VEGF (50 ng/ml), recombinant TSR (10 nM), LPA (10 μM) and CID 755673 (25 μmol/L) were injected into mice and analyzed histologically after 10d. Bar graph shows the relative angiogenic responses and vascular invasion in the Matrigel plugs (left panel). Additionally, LPA signaling promotes vascular remodeling. Matrigel plugs mixed with a combination of VEGF (50 ng/ml) and LPA (10 μM) or VEGF and LPA plus LPA receptor 1,3 antagonist Ki16426 (2 μM) were respectively injected into mice and analyzed histologically after 10d. Representative Masson’s Trichrome stained images are shown and bar graph shows vascular invasion relative to VEGF stimulation (right panel; p >0.05; bar 50 μm). Images were acquired with a Nikon Eclipse E600 microscope and NIH Image J was used for the analysis of vascular invasion. ns: no significant statistical difference. C, LPA stimulates the formation of SMA positive vessels. Matrigel plugs were sectioned and examined with an EVOS®FL imaging system using antibodies to alpha SMA (green) and nuclei was stained with DAPI (blue), and representative images are shown, bar = 200 μM. Images with positive SMA staining were randomly collected and the positive cells counted with NIH image J. The average cell number was calculated in each visual field and compared between VEGF and LPA plus VEGF groups (p <0.05, upper and lower left panel). Additionally, VSMCs were exposed to the conditioned media from HMVECs treated with LPA or LPA and PKD inhibitor, and cell proliferation was assessed by an alamarBlue® Cell viability assay (lower right panel). Two independent experiments were performed, and the cell proliferation is represented as relative fluorescence intensity. LPA conditioned media significantly increases VSMC proliferation (p<0.05; ns: no significant statistical difference). D, Tumors harvested from C57Bl and cd36+/+ mice after transplantation of Lewis Lung carcinoma cells were sectioned and examined by immunofluorescence microscopy using antibodies to VEGFR2 (red) and CD36 (green). Nuclei were stained with DAPI (blue) (100×). CD36 expression in skin adjacent to the tumors and sections incubated with CD36 antibodies or non-immune IgG are shown as positive and negative controls. Representative results are shown. E, Tumor vessels as in Panel D were examined by immunofluorescence using antibodies to phospho-PKD-1 (white) in wild type or the cd36 null mice, and no PKD-1 phosphorylation was shown in the skin adjacent to the tumor tissues. VEGFR-2 (red) staining was shown in the tumor tissues to visualize the angiogenic response in the cd36 null mice. H&E staining is used to show tumor tissues in both wild type and cd36 deficiency mice (40×). Representative images are shown. F, Tumor vessels were examined by immunofluorescence using antibodies to EFNB2 (magenta) in wild type or the cd36 null mice. Representative images are shown. G, Tumor vessels were examined by immunofluorescence using antibodies to alpha SMA and VEGFR2 and DAPI was used for staining the nuclei (VEGFR2 red, SMA green, DAPI blue) in wild type or the cd36 null mice. Images were randomly acquired with a Zeiss Axioskop Microscope with Photometrics Cool SNAP ES Camara system using Metamorph v7 software or EVOS®FL cell imaging system, and representative images are shown (left panel). NIH Image J was used to analyze the integrated fluorescence density (IFD) of SMA positive cells (green) in the hypervascular areas of the tumor microenvironment. The average IFD was used to assess the relative number of SMA positive cells in the neovessels and compared between wild type and cd36 null mice. No significant statistical difference was found between these two groups (p > 0.05, right panel).
