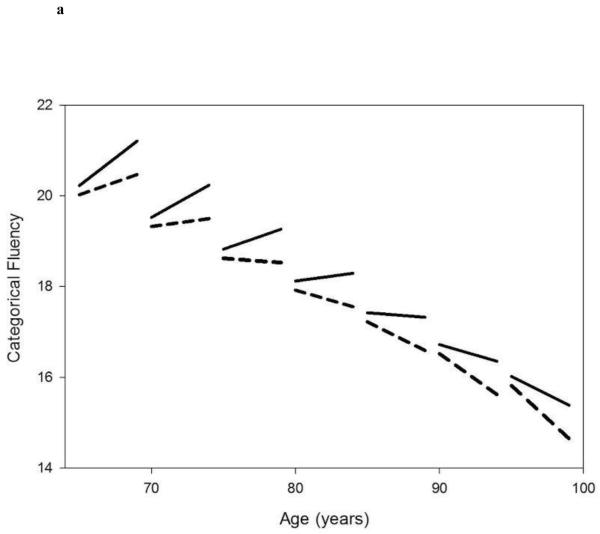
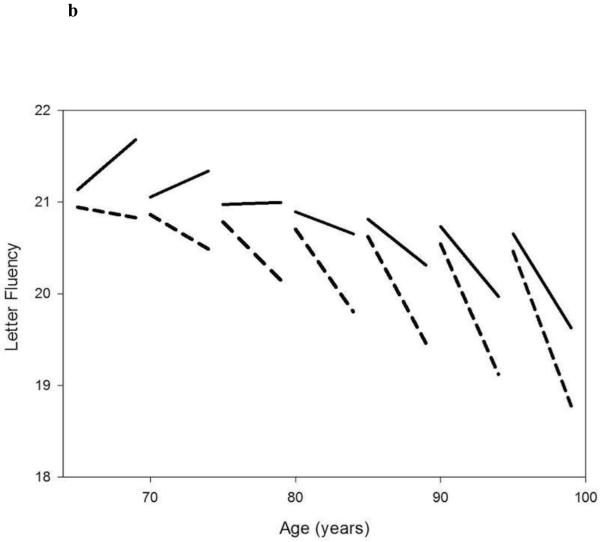
Figures 1A and 1B.
Linear mixed model estimated trajectories of decline in cognitive performance in Category Fluency Test (fig 1A) and Letter Fluency Test (fig 1B) in participants with faster accumulation of diseases overtime (25%, red lines) versus the rest of the population (75%, dark lines), according to different baseline age groups.
Note: Possible range of values (best-worse) for Categorical and Letter Fluency are 35-0 and 31.7-0, respectively.


