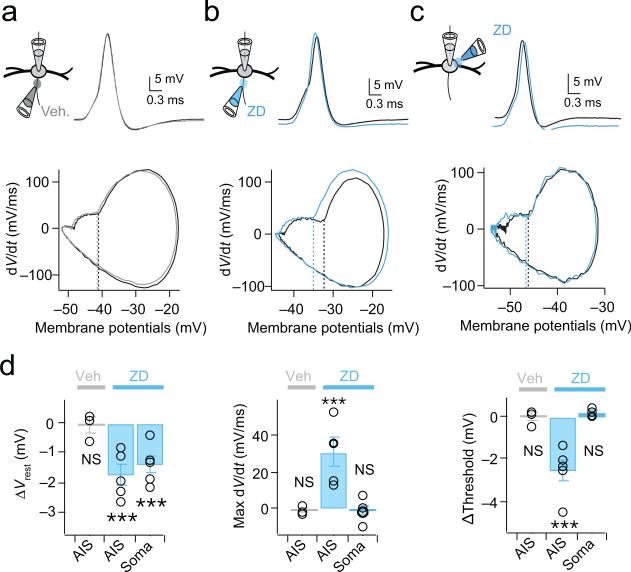
Figure 5. Local pharmacological blockade of HCN channels in the AIS mimics the effects of photoswitches.
(a) Top: First suprathreshold spike in response to a train of somatic simulated EPSCs (100 Hz; 0-6 nA, 0.4 pA steps) in a whole-cell current clamp recording in control (black) and following brief focal pressure application of a NaCl-based vehicle onto the AIS (gray) Bottom: Phase plot of the first spike under each condition. Dotted lines: spike threshold. The vehicle (gray) alters neither the shape, maximum rate of rise (dV/dt), or threshold of spikes. Vrest = –59 mV for both control and vehicle. (b) Brief focal pressure application of 50 μM ZD7288 onto the AIS (blue) hyperpolarizes both the resting potential (Middle) and action potential threshold (phase plot, middle), and increases maximum dV/dt of the spike. Vrest = –52 mV (control), –54 mV (ZD7288). (c) Focal application of 50 μM ZD7288 to the soma on the opposite side of the AIS hyperpolarizes the resting potential but does not change the threshold or shape of the action potential. Vrest = –59 mV and –61 mV for control and ZD7288, respectively. (d) Group data quantifying average changes in resting membrane potential, voltage threshold and maximum rate of rise of spikes with focal ZD7288 blockade of HCN channels in the AIS (ΔVrest: Veh., p=0.77, ZD(AIS), p=0.07, ZD(Soma), p=0.01; ΔThreshold: Veh., p=0.88, ZD(AIS), p=0.008, ZD(Soma), p=0.08; ΔMax dV/dt: Veh., p=0.51, ZD(AIS), p=0.01, ZD(Soma), p=0.71; Veh, n=3; ZD, n=5). 2-tailed paired t test. Error bars indicate SEM. *** p<0.001

