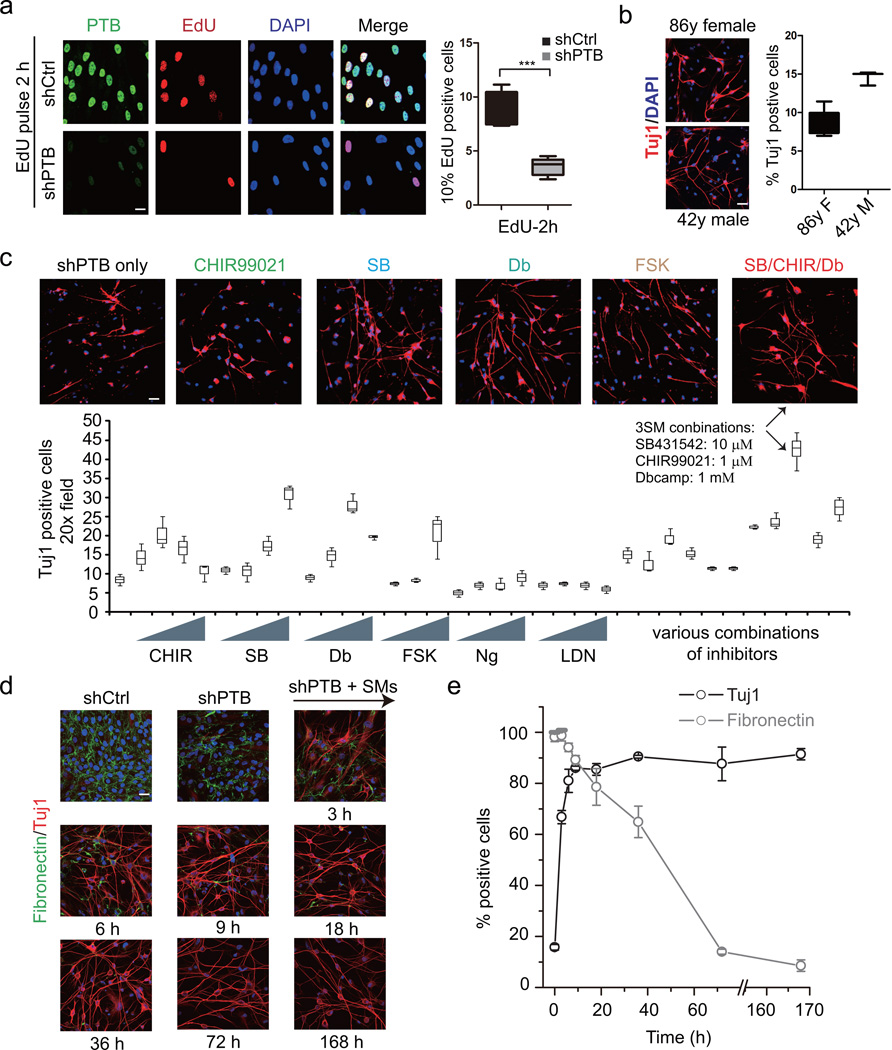
Figure 1. Quantitative neuronal induction by shPTB in combination with small molecule inhibitors on HAFs.
(a) EdU pulse labeling in response to PTB depletion. Right panel: Quantification of EdU signals in shPTB and control shRNA-treated cells (n=5 random 20x fields). Two-tailed unpaired Student’s t test was applied to calculate significance. The statistic significance in comparing shCtrl- and shPTB-treated samples is determined: degree of freedom (υ)=8, t = 6.87, P = 0.000127. *** indicates P<0.001.
(b) PTB knockdown in two primary HAF lines and cultured in N3 media for 14 days The efficiency was calculated against total seeding cells in each case (n=6 random 20x fields for 86y female, n=3 random 20x fields for 42y male). All remaining figures were performed on HAFs from the 42y male.
(c) Screen for small molecule inhibitors for enhanced conversion of HAFs to neuronal-like cells in combination with PTB knockdown. Small molecules tested include CHIR (CHIR99021), SB (SB431542), Db (Db-cAMP), FSK (Forskolin), Ng (Noggin), and LDN (LDN-193189). Each compound was titrated in three or four concentrations (see Methods). Tuj1-positive cells were counted from two to four randomly selected fields under 20X magnification. The highest efficiency with CHIR(1 µM)/SB(10 µM)/Db(1 mM) is highlighted by the arrows.
(d) Expression of Tuj1 (red) and the fibroblast marker Fibronectin (green) in HAFs treated with control shRNA or shPTB for 3 days followed by the addition of the three small molecule inhibitors for different periods of time as indicated (n=3 independent biological repeats). Nuclei were stained with DAPI (Blue).
(e) The percentage of cells showing Tuj1 and Fibronectin expression against total seeding cells in different treatment points (n=3 independent biological repeats). All data are presented as mean± SD. All scale bar: 20 µm. See also Supplementary Figure 1.

