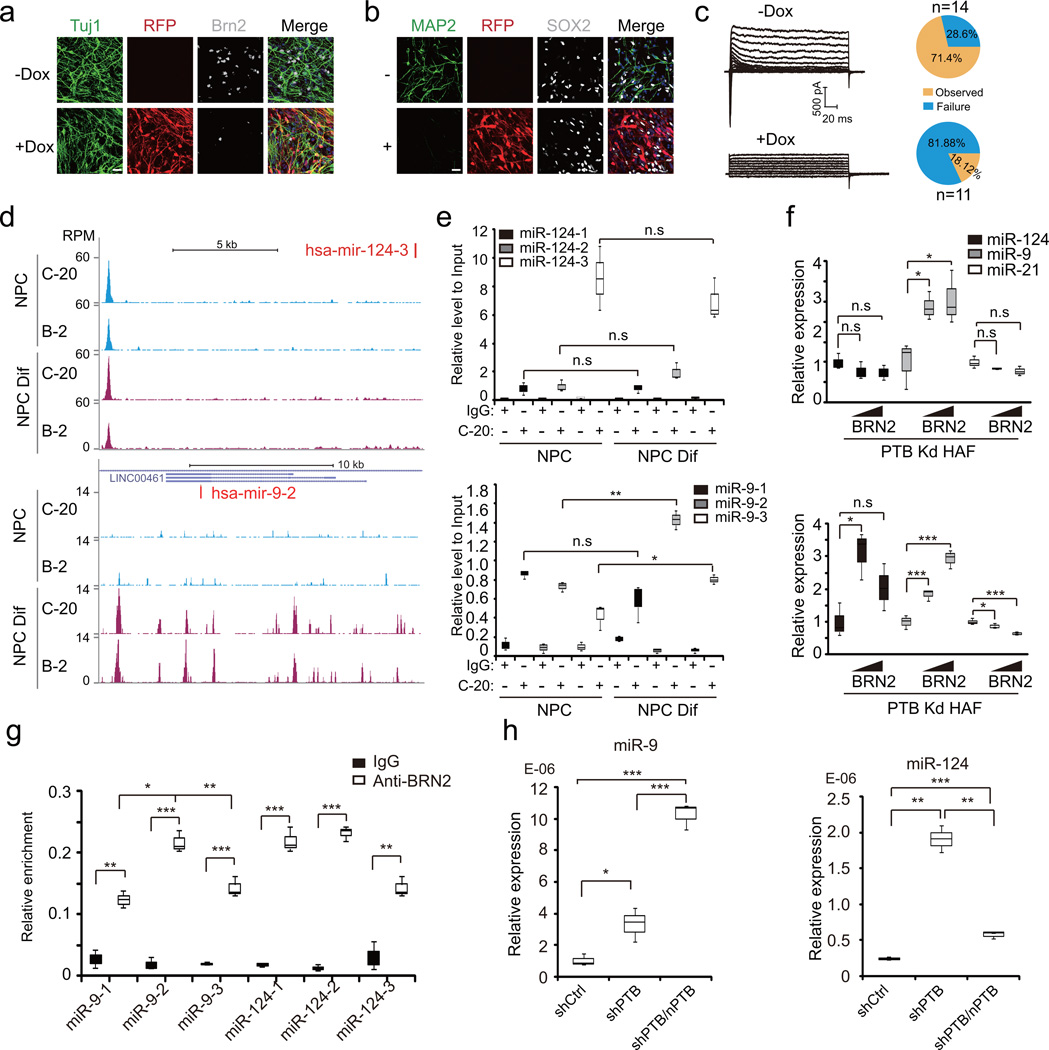
Figure 4. Essential role of BRN2 for neuronal maturation in hNPCs and activation of mature neuron-specific miRNAs.
(a) Immunofluorescence analysis of neurons derived from hNPCs upon BRN2 knockdown. n=3 independent biological repeats. Scale bar: 20 µm
(b) Expression of SOX2 (bright, infrared-fluorescence), but not MAP2 (green), in BRN2-depleted hNPCs. n=3 independent biological repeats. Scale bar: 20 µm
(c) Representative trace of whole-cell currents recorded on neurons derived from hNPCs with or without BRN2 expression. Pie charts: % cells exhibiting the currents before (top) and after (bottom) BRN2 knockdown.
(d) Representative BRN2 ChIP-seq signals on miR-124-3 and miR-9-2 loci before or after hNPC differentiation. Two anti-BRN2 antibodies (Mouse monoclonal IgG B-2 and goat IgG C-20) were used for constructing ChIP-seq libraries. Y-axis: tag density. See also Supplementary Table 2 for the list of identified BRN2 targets.
(e) ChIP-qPCR analysis of BRN2 binding (with C-20 antibody; IgG as negative control) on miR-124 (top) and miR-9 loci (bottom) before and after hNPC differentiation. n=3 independent experiments. Two-tailed unpaired Student’s t-test was applied to calculate significance. For miR-124: box 2/8: υ=4, t=0.0304, P=0.977; box 10/4: υ=4, t=2.365, P= 0.0772: box 12/6: υ=4, t =1.059, P=0.349; For miR-9: box 2/8: υ=4, t=2.339, P=0.0795; box 10/4: υ=3, t=8.583, P=0.00332; box 6/12: υ=4, t=4.577; P=0.0102..
(f) RT-qPCR analysis of miR-124 and miR-9 after induced BRN2 expression for 6 (upper panel) or 12 (lower panel) days in shPTB-treated HAFs. U6 served as internal control. n=3 independent experiments. For 6 days: box 1/2: υ=4, t=1.263, P=0.275; box 1/3: υ=4, t=1.615, P=0.182; box 4/5: υ=4, t=3.529, P=0.0243; box 4/6: υ=4, t=3.059, P=0.0377; box 7/8: υ=4, t=1.802, P=0.146 ; box 7/9: υ=4, t=1.995, P=0.117. For 12 days: box 1/2: υ=4, t=4.069, P=0.0152; box 1/3: υ=4, t=2.051, P=0.110; box 4/5: υ=4, t=5.213, P=0.00646; box 4/6: υ=4. t=9.356, P=0.000727; box 7/8: υ=9, t=3.066, P=0.0134; box 7/9: υ=9, t=8.037; P = 0.0000213.
(g) RRN2 ChIP-qPCR analysis (with C-20 antibody; IgG as negative control) on miR-124 and miR-9 loci in HAF-derived neurons after sequential knockdown of PTB and nPTB. For box 1/2: υ=3, t=6.484, P=0.0074; box 3/4: υ=4, t=16.616, P=0.00076; box 2/4: υ=3, t=5.446, P=0.0122; box 5/6: υ=4, t=12.795, P=0.00022; box 4/6: υ=4, t=5.154, P=0.0067; box 7/8: υ=3, t=13.218, P=0.00094; box 9/10: υ=4, t=30.228, P = 0.000007; box 11/12: υ=4, t=5.684, P = 0.0047. n=3 independent experiments.
(h) RT-qPCR analysis of miR-124 and miR-9 after PTB knockdown or sequential PTB/nPTB knockdown in HAFs. U6 served as internal control. For miR-9: box 1/2: υ=4, t=3.496, P=0.0249; box 1/3: υ=4, t=17.595, P=0.0000613; box 2/3: υ=4, t=8.835, P=0.00091, For miR-124: box 1/2:,υ=3, t=11.886, P=0.00128; box 1/3: υ=4, t= 11.572, P=0.00032; box 2/3: υ=3, t=9.315, P=0.00262. n=3 independent experiments. ns: non-significant; *P<0.05, **P<0.01, ***P<0.001). All data were presented as mean± SD. See also Supplementary Figure 4 and the list of primers used in these analyses in Supplementary Table 3.

