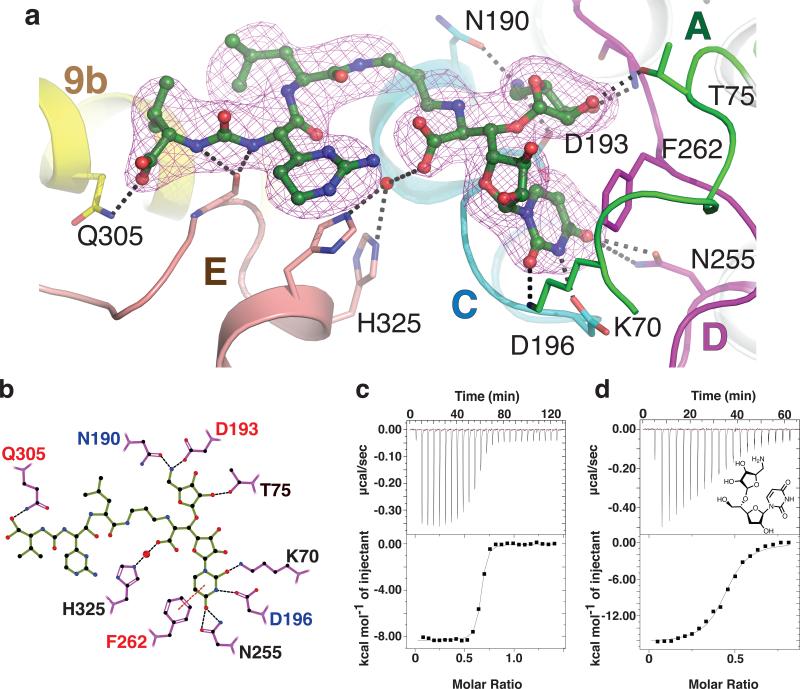
Figure 4. Dissection of the interactions between MD2 and MraYAA elucidates the chemical logic of MraYAA inhibition.
a, Composite simulated annealing 2Fo–Fc omit electron density of MD2 in the crystal structure of MD2-bound MraYAA at 1.7σ. The TMs are colored as in Fig. 3, a-b. The residues forming side chain interactions with MD2 are labeled. b, A two-dimensional representation of the interactions between MD2 and MraYAA. Hydrogen bonds (3.2 Å cutoff) are indicated with black dashed lines and π–π contacts are indicated with red dashes. Mutation of residues with red colored labels resulted in a larger than five-fold increase in the KD of MD2 and those with blue residue labels are nearly inactive. c, Representative ITC raw data and binding isotherm for MD2 titrated into MraYAA in the absence of added Mg2+; KD = 14.8 nM, ΔH° = −8.3 kcal/mol. A similar KD is observed for MD2 titrated into MraYAA with added Mg2+. d, Representative ITC raw data and binding isotherm for 5-aminoribosyl-3-deoxy uridine titrated into MraYAA WT; KD = 283 nM, ΔH° = −16.4 kcal/mol. Each ITC experiment was performed in triplicate (technical replicates) and mean thermodynamic parameters are shown in Extended Data Table 2.

