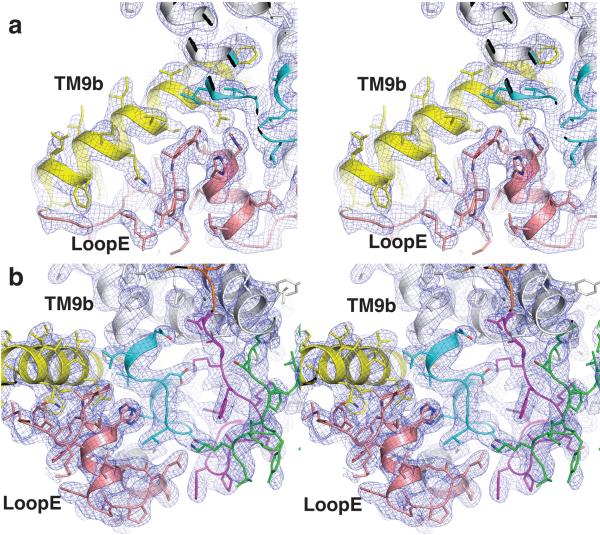
Extended Figure 3.
Quality of electron density map surrounding MD2. a, Stereo view of 2Fo–Fc electron density map at 1σ for TM9b and loop E. b. Stereo view of 2Fo–Fc electron density map at 1σ for the MD2 binding pocket. The electron density peaks corresponding to MD2 are carved for clarity and all TMs are colored as in Fig. 3.

