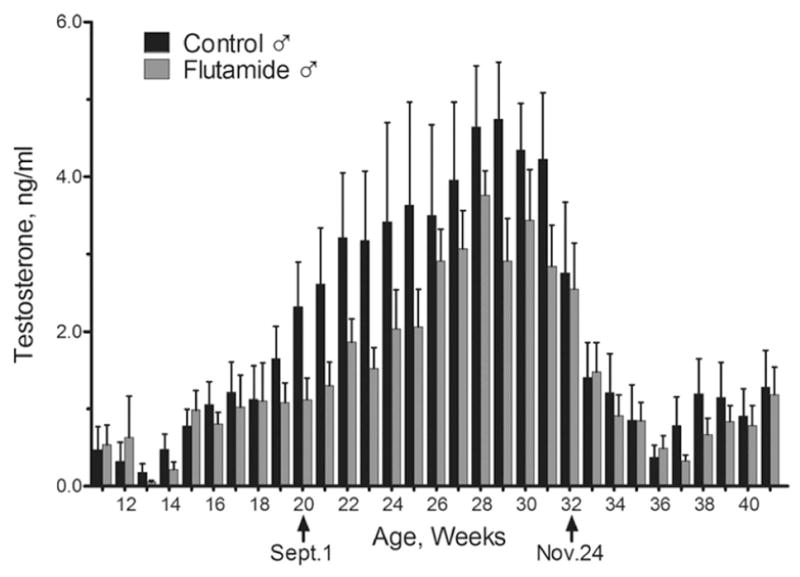
Figure 2.

Mean ± SEM serum concentrations of T in control (n=7) and Flu ram (n=7) lambs from 3 months of age through the end of January during the first breeding season. 2-way ANOVA for repeated measures revealed that T concentrations were significantly greater (P < 0.05) in control vs. Flu ram lambs between September 1 and November 24.
