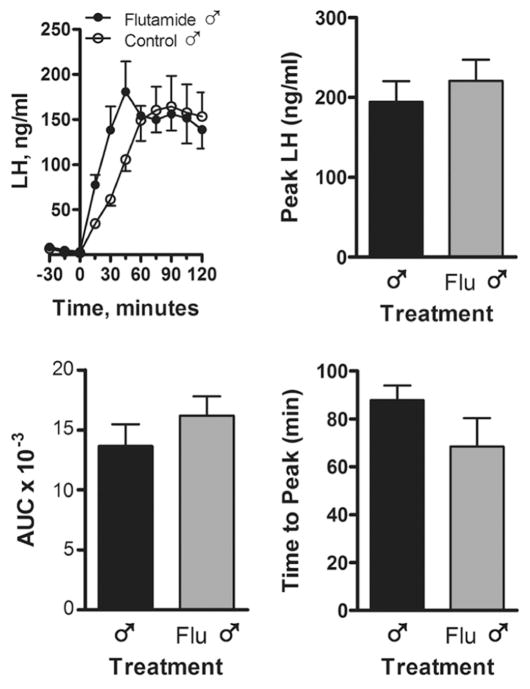
Figure 4.
LH secretion in response to an i.v. injection of GnRH (100 μg/animal) in control and Flu rams (n=7 rams per group). Blood samples were collected every 15 min before and after GnRH administration. Time = minutes before or after GnRH injection. AUC, area under the curve. Values are mean ± SEM.

