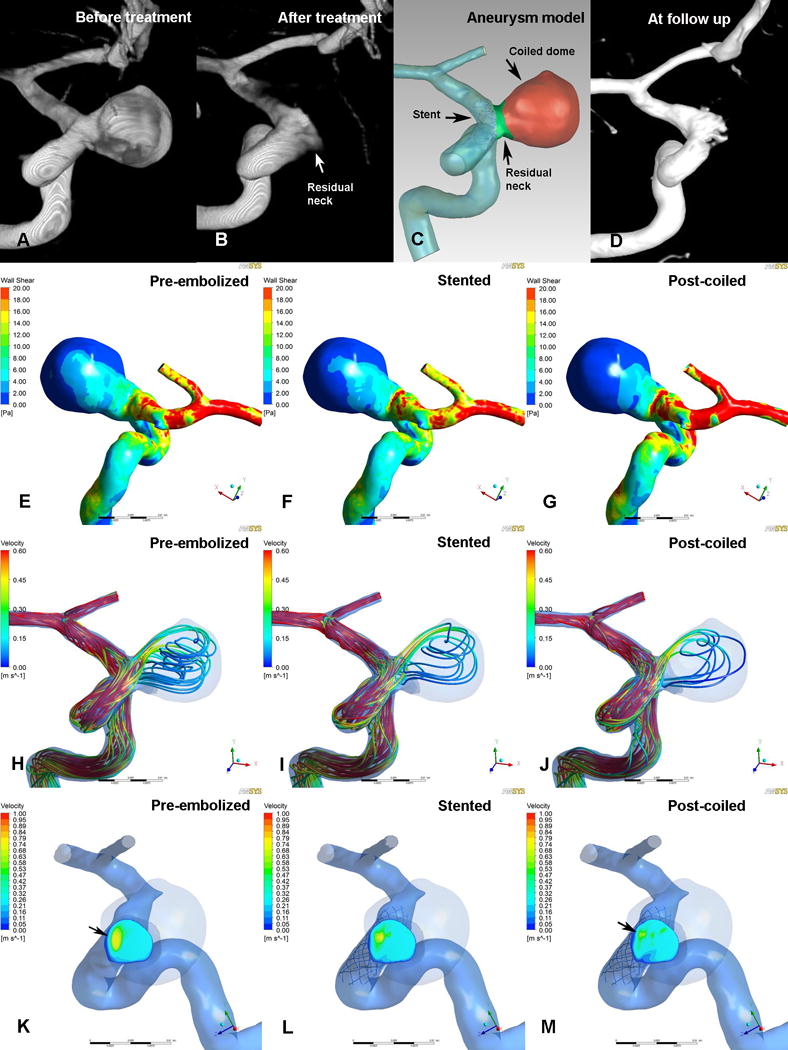
Figure 4.

Illustrations of pre-embolized (E, H and K), stented (F, I and L) and post-coiled (G, J and M) hemodynamics in a case that was stable at follow-up. The angiographic images before treatment (A), after treatment (B), at follow up (D) and reconstructed aneurysm model (C) were depicted in the first row. Second row (E, F and G): WSS distribution. Third row (H, I and J): velocity streamlines. Fourth row (K, L and M): velocity distribution on the neck plane. After stent-assisted coiling, markedly reductions in wall shear stress and velocity were demonstrated (G, J and M) and no high or concentrated velocity region at neck plane (M, black arrow).
