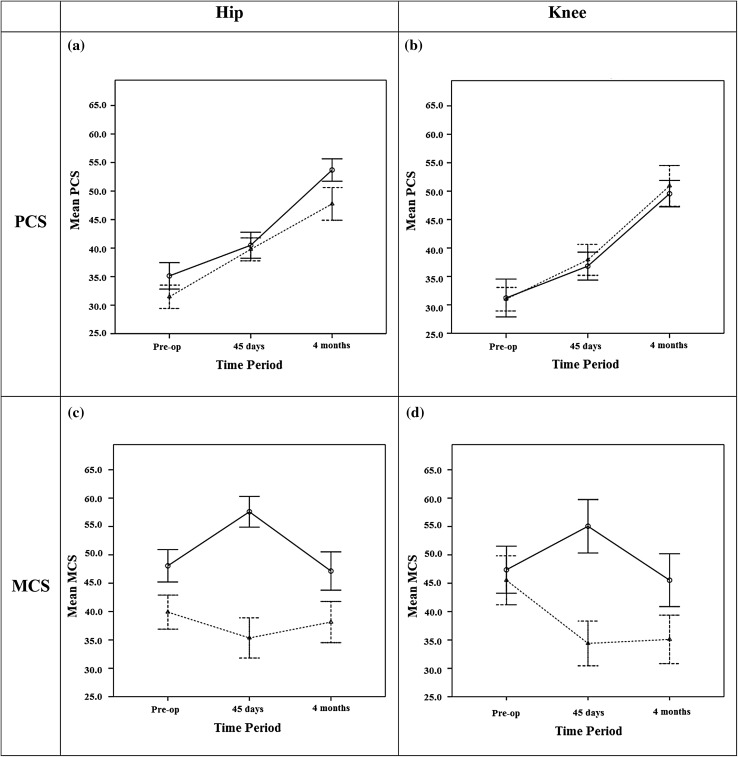
Fig. 1.
Temporal trend of the ‘Physical Component Scale’ (PCS) and the ‘Mental Component Scale’ (MSC) of the SF-36 questionnaire for the hip population ((a) and (c), respectively) and for the knee population ((b) and (d), respectively). The solid lines indicate the experimental group while the dashed lines indicate the control group. Means are shown as circles while the bars represent the 95 % confidence interval. An evident overlapping between the bars indicates lack of significant statistical difference

