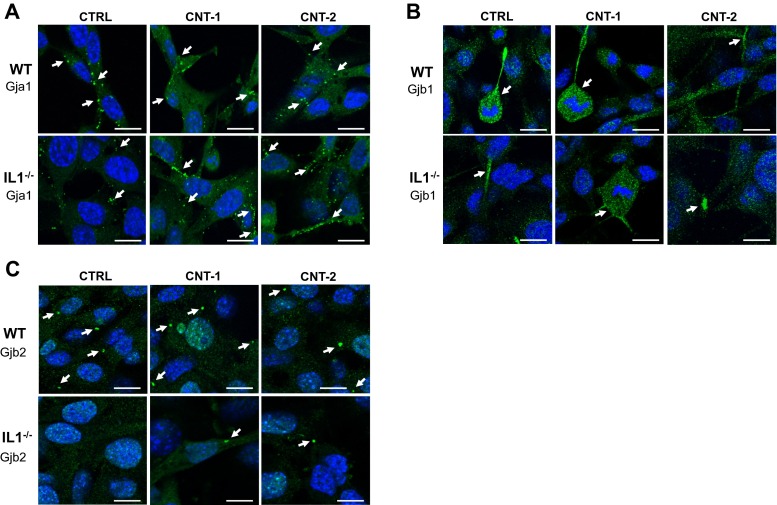
Fig. 2.
Immunofluorescence images of Gja1, Gjb1 and Gjb2 in IL1-WT and IL1-KO cells after exposure to CNT-1 and CNT-2. IL1-WT and IL1-KO cells were plated on cover slips and were allowed to attach for 24 h before exposure to CNTs or dispersion media alone for 24 h. Cells were stained with the respective antibodies and fluorescent secondary antibodies were used to detect expression. Hoechst staining was used to visualize cell nuclei. a Representative images for Gja1. b Representative images for Gjb1. c Representative images for Gjb2. Arrows indicate interesting areas with hemichannels and gap junction channels when present between cells. For Gjb1 arrows also point to dividing cells having increased expression of Gjb1. Scale bar: 10 μm

