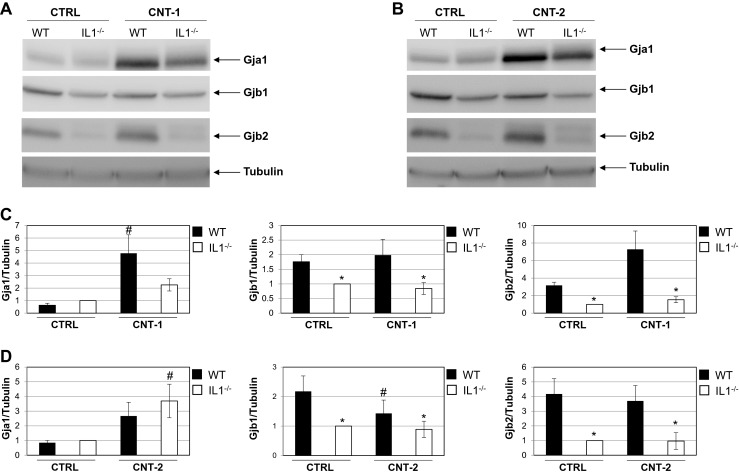
Fig. 4.

Gja1, Gjb1 and Gjb2 protein levels in IL1-WT or IL1-KO cells after exposure to dispersion media alone, CNT-1 or CNT-2. a Representative western blots for Gja1, Gjb1 and Gjb2 after exposure to CNT-1. b Representative western blots for Gja1, Gjb1 and Gjb2 after exposure to CNT-2. Tubulin was used as a loading control. c Quantification of Gja1, Gjb1 and Gjb2 protein levels normalized to tubulin after exposure to CNT-1. d Quantification after exposure to CNT-2. For the bar graphs the values represent the mean ± standard error (SE) of three independent experiments. * P < 0.05 between IL1-WT and IL1-KO cells. # P < 0.05 between exposed IL1-WT or IL1-KO and their respective non-exposed controls
