
Figure 3.
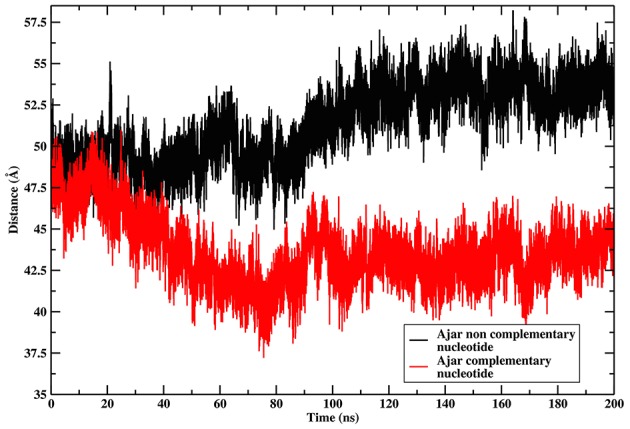
Time evolution of the distance between the residues corresponding to the positions of FRET probes. The graph reports on the time evolution of the distance between the residues corresponding to the positions of the FRET probes in the Ajar conformations, indicating the different conformational behavior in the presence of the correct nucleotide (red-line, closure motion), or in the presence of the incorrect nucleotide (black-line, opening motion).