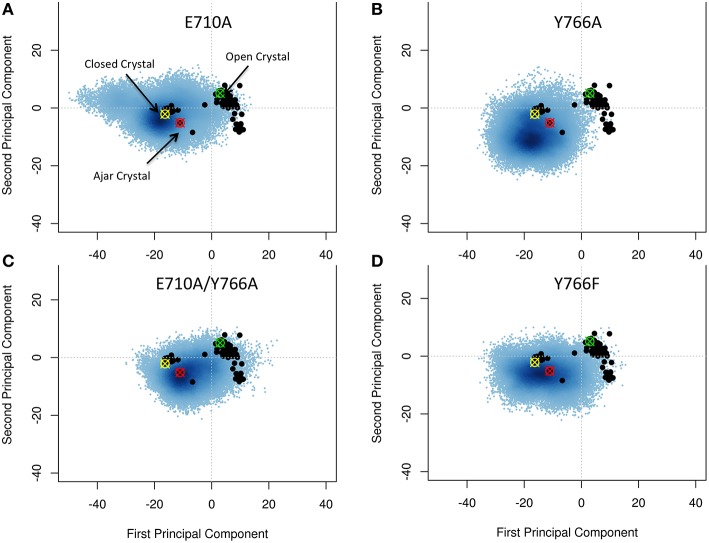
Figure 4.
Characterization of the essential subspaces covered by the fidelity modulating mutators simulations. The black dots indicate the experimental crystal structures, while the blue cloud recapitulates the conformational space spanned by the simulations. The starting crystal structures are indicated by colored-crossed circles: Yellow, Closed; Red, Ajar; Green, Open. (A) E710A simulation; (B) Y766A simulation; (C) Double mutant simulation; (D) Y766F simulation.

