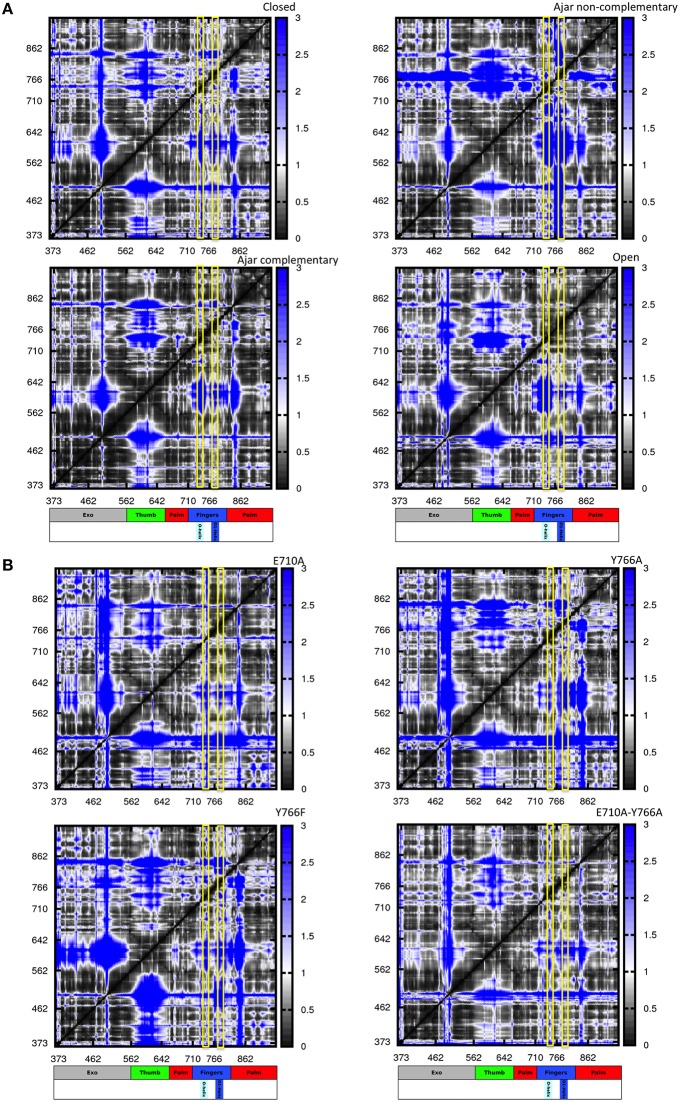
Figure 5.
Distance fluctuation matrices for the different structures and different sequences. The magnitude of pairwise distance fluctuations is color coded from black (small fluctuations) to blue (large fluctuations). The different scale of pairwise fluctuations among the different molecules reflects the different degrees of internal mobility. The color coded bar represents the different domains of the protein, with helices O and O1 highlighted. (A) Wild type simulations; (B) Mutant simulations.

