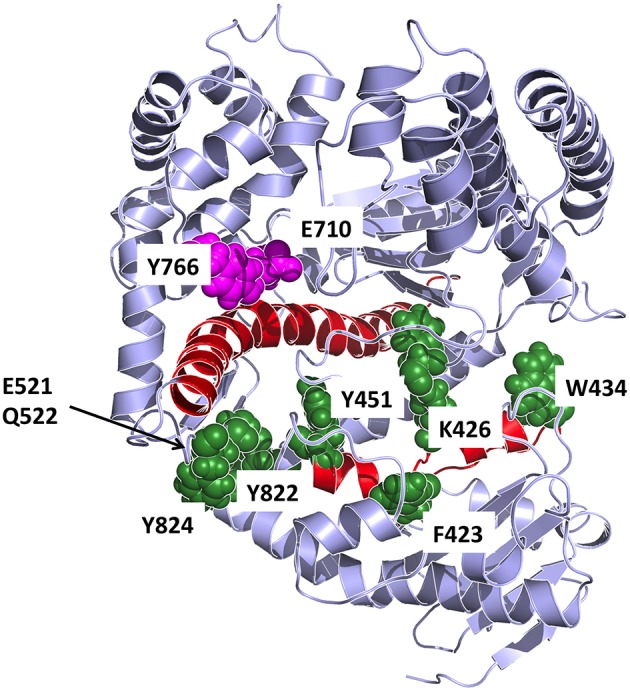
Figure 8.

Detailed representation of the principal interaction networks. The residues that are most involved in conformational regulation on the basis of energetic and coordination analysis are depicted in the structure as van der Waals spheres, colored in dark green. The two helices responsible for transmitting the signal from the catalytic site are colored in red. Catalytic residues are colored in magenta.
