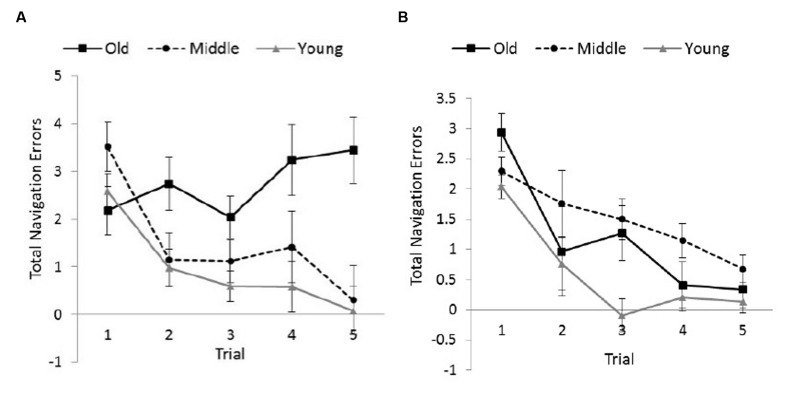
FIGURE 5.
Total number of navigation errors committed by female (A) and male participants (B) as a function of Age Group and Trial. Adjusted means and SEs are shown after controlling for the covariate effect of computer experience. Compared to other groups, older females showed little improvement across trials. Error bars indicate ± 1 SE.

