
FIGURE 9.
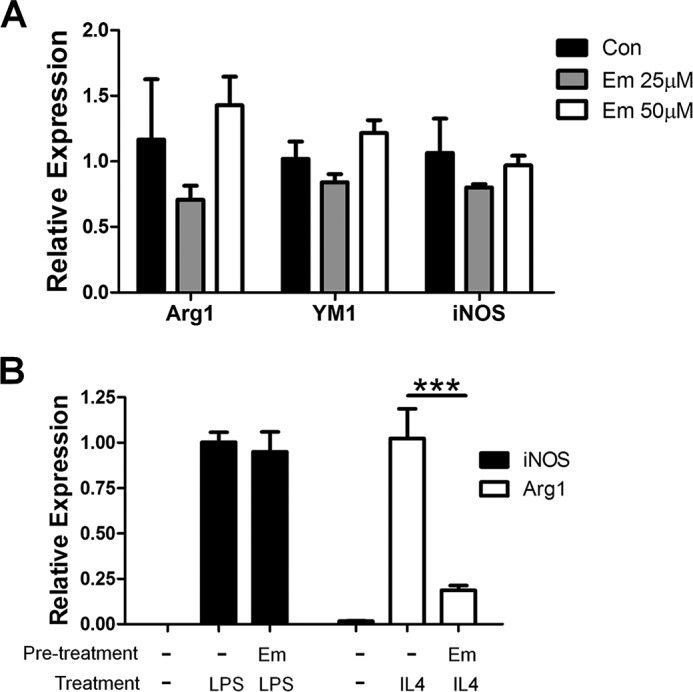
The effects of emodin on naive macrophages. A, macrophages were incubated with various concentrations of emodin (0–50 μm) for 24 h, and gene expression was analyzed using qPCR. Con, control. B, macrophages were incubated with or without emodin (50 μm) for 24 h. Then the cells were washed and incubated for 2 days and further stimulated with either IL4 or LPS for 6 h, and gene expression was analyzed with qPCR. Results are shown as the mean ± S.E. for two independent experiments (n = 3). *, p ≤ 0.05; **, p ≤ 0.01.