FIGURE 8.
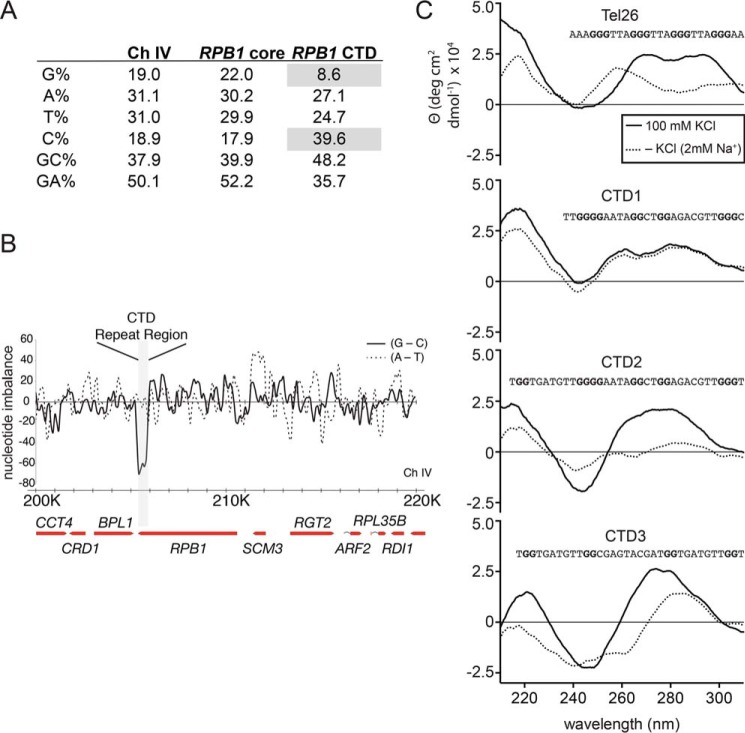
GC imbalance marks the CTD coding region and contributes to secondary structure formation. A, nucleotide statistics for the core of RPB1 and the CTD region. The CTD coding strand has reduced guanine bases and a high concentration of cytosine (gray). B, plot of nucleotide differences for a 20-kilobase region of yeast chromosome IV including RPB1. The data were calculated from 150-base pair windows with 50 base pairs of overlap between adjacent windows and plotted in Excel. The CTD region has a very negative value of G-C. A-T for this same region is less variable. C, circular dichroism for G-rich DNA from the noncoding strand of the CTD identified as potential G4-DNA forming sequences using QGRS mapper and a known G4-DNA forming region of human telomeres (Tel26). The data were collected in the presence (solid line) and absence (dotted line) of 100 mm KCl. In the presence of potassium ions, all three oligonucleotides derived from the CTD coding sequence exhibit a minimum near 240 nm and a broad positive peak between 260 and 300 nm.

