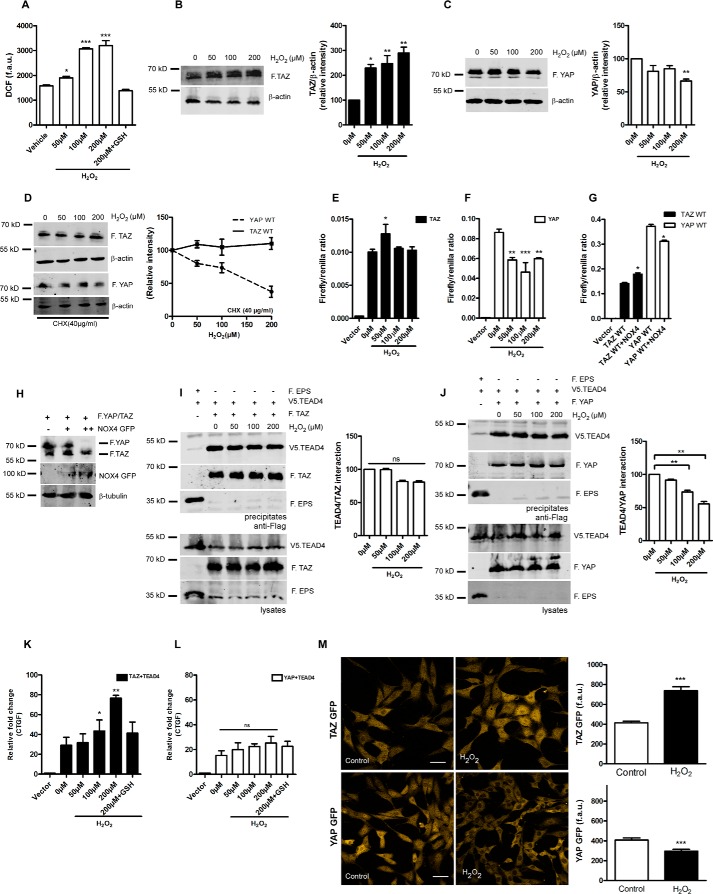
FIGURE 1.
H2O2 elevates total protein levels of TAZ and increases TAZ/TEAD activity. A, HEK 293T cells were challenged with 50, 100, and 200 μm H2O2 for 1 h. After treatment, cells were loaded with a cellular ROS indicator (H2DCFDA), and changes in fluorescence arbitrary units (f.a.u.) were quantified using a microplate reader. B and C, HEK 293T cells expressing FLAG.TAZ (F.TAZ) or FLAG.YAP (F.YAP) were challenged with 50, 100, and 200 μm H2O2 for 1 h. Western blotting and densitometry analysis reveals elevated protein levels of TAZ but not YAP. D, HEK 293T cells expressing FLAG.TAZ or FLAG.YAP were pretreated with cycloheximide (CHX, 40 μg/ml) for 1 h. Cells were then challenged with 50, 100, and 200 μm H2O2 for an additional 1 h. Western blotting and densitometry analysis reveals stable protein levels of TAZ but not YAP. E and F, HEK 293T cells were treated with 50, 100, and 200 μm H2O2 for 6 h. H2O2 enhances the activity of the transcriptional coactivator TAZ (E) but not YAP (F) in TEAD reporter assays, as described under “Experimental Procedures.” G, HEK 293T cells expressing FLAG.TAZ or FLAG.YAP were co-transfected with NOX4. NOX4 enhances the activity of the transcriptional coactivator TAZ but not YAP in TEAD reporter assays. H, immunoblotting of whole cell lysates reveals that increasing amounts of NOX4 degrades YAP in a dose-dependent manner but not TAZ. I and J, HEK 293T cells expressing FLAG.TAZ and V5.TEAD4 or FLAG.YAP and V5.TEAD4 were treated with increasing concentrations of H2O2 for 1 h. Cells expressing FLAG.EPS and V5.TEAD4 served as negative control. Co-immunoprecipitation reveals that H2O2 does not significantly alter the TAZ/TEAD4 interaction but that the YAP/TEAD4 interaction is perturbed. K and L, CTGF expression levels analyzed by qPCR reveal that TAZ induces CTGF expression following 6-h H2O2 treatment, which is reversed by antioxidant pretreatment. In contrast, YAP-induced CTGF expression is not significantly altered by H2O2. M, NIH-3T3 TAZ or YAP GFP flp-in stable cells were exposed to 250 μm H2O2 for 1 h. Shown are representative confocal images and quantification of GFP fluorescence. Scale bars = 50 μm. Data are mean ± S.E. from three independent experiments (*, p < 0.05; **, p < 0.01; ***, p < 0.001; ns, not significant).

