FIGURE 3.
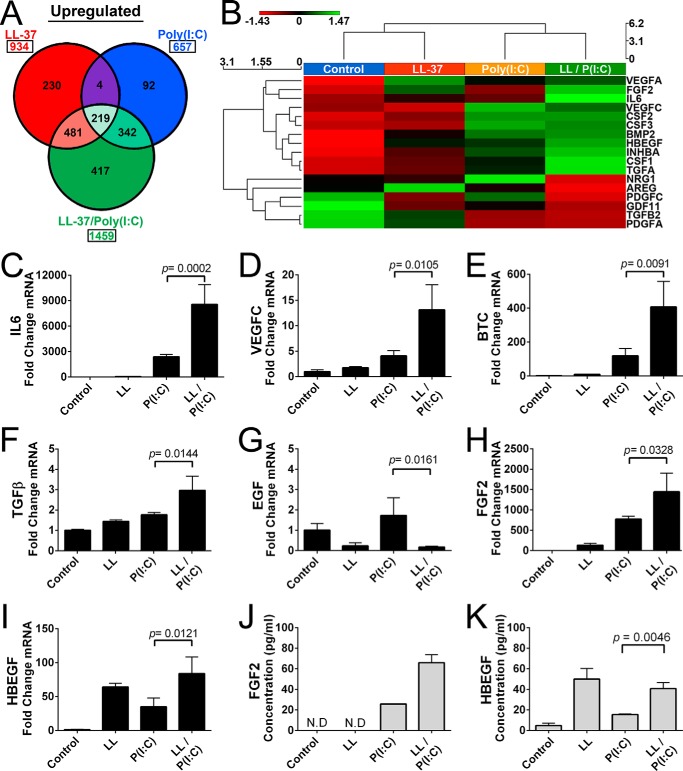
Growth factor response to poly(I:C) is enhanced by LL-37. A, analysis of RNA-seq gene profiling for genes in NHEKs after a 24-h exposure to dsRNA mimic 0.1 μg/ml poly(I:C) (P(I:C)), 4 μm LL-37 (LL), or 0.1 μg/ml poly(I:C) and 4 μm LL-37 (LL/P(I:C)) co-stimulation. Genes represented follow the guidelines established in Fig. 1. B, heat map generated from selected cytokines and growth factors from A. C–I, qPCR measurement of IL-6, VEGFC, BTC, EGF, FGF2, and HBEGF from NHEKs following protocols described in Fig. 1. J and K, ELISA of supernatant of NHEKs from H and I, respectively. p values were calculated by one-way analysis of variance. qPCR data are mean ± S.D. of biological replicates, n = 3, and are representative data from four independent experiments. Samples not detected by ELISA are indicated by the abbreviation N.D. Error bars represent S.D.

