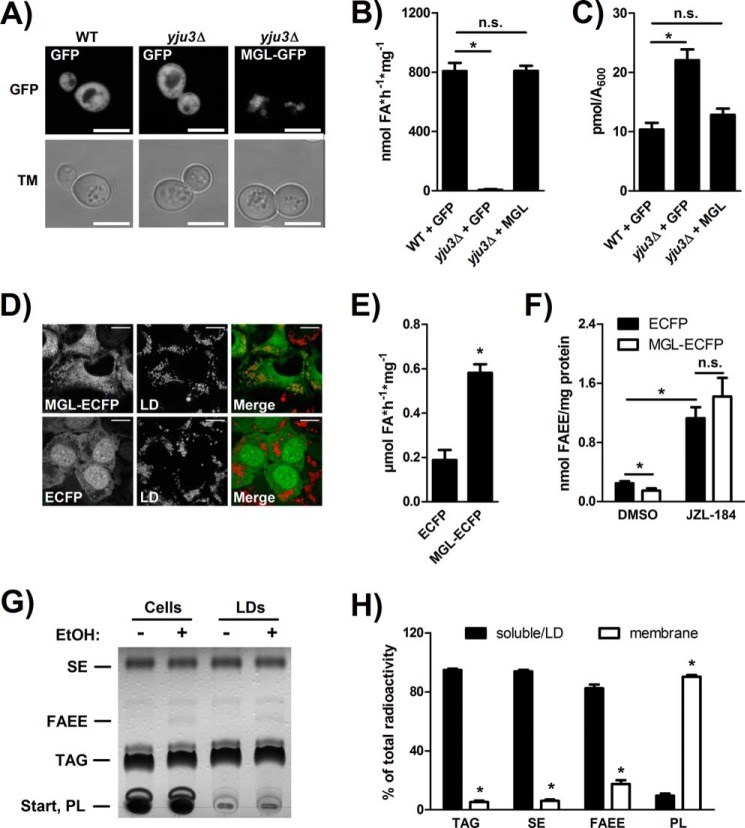
FIGURE 6.
Subcellular localization and FAEE hydrolase activity of murine MGL. A, confocal fluorescence microscopy of WT yeast overexpressing GFP or GFP-MGL. Cells were cultivated in MM lacking uracil and methionine and imaged in the late log phase. Scale bars: 5 μm. TM, transmission. B, incorporation of [14C]palmitic acid into FAEE in WT and yju3Δ cells overexpressing GFP and in yju3Δ cells overexpressing GFP-MGL. Cells cultivated to the late log-phase were labeled with [14C]palmitic acid. Lipids were separated by TLC, and the radioactivity associated with FAEE was determined. C, FAEE hydrolase activity of yeast 1000 × g supernatants. GFP-MGL was overexpressed in yju3Δ cells, and the cellular FAEE hydrolase activity was determined in comparison with GFP-expressing WT and yju3Δ cells. D, confocal fluorescence microscopy of AML-12 cells stably overexpressing MGL-ECFP or ECFP. LDs were detected using LipidTOX™ Deep Red. Scale bars: 10 μm. E, FAEE hydrolase activity of AML-12 cell homogenates stably overexpressing ECFP or MGL-ECFP. F, incorporation of [14C]oleic acid into FAEE in AML-12 cells stably overexpressing ECFP or MGL-ECFP. Cells were incubated with [14C]oleic acid in the absence or presence of ethanol and JZL-184. Subsequently, lipids were separated by TLC, and the radioactivity associated with FAEE was determined. G, lipid analysis of AML-12 cell homogenates and isolated LDs. Cells were incubated with oleic acid, ethanol, and JZL-184. Subsequently, lipids of cell homogenates and isolated LDs were analyzed by TLC. H, distribution of lipid classes between soluble/LD and membrane fractions. AML-12 cells were incubated with [14C]oleic acid, ethanol, and JZL-184. Subsequently, lipids were separated by TLC, and the radioactivity associated with individual lipid classes within membrane or soluble/LD fractions was determined. PL, phospholipids. Data are presented as the means ± S.D. (n = 3). Statistical significance was determined using Students unpaired t test. *, p < 0.05; n.s., not significant.

