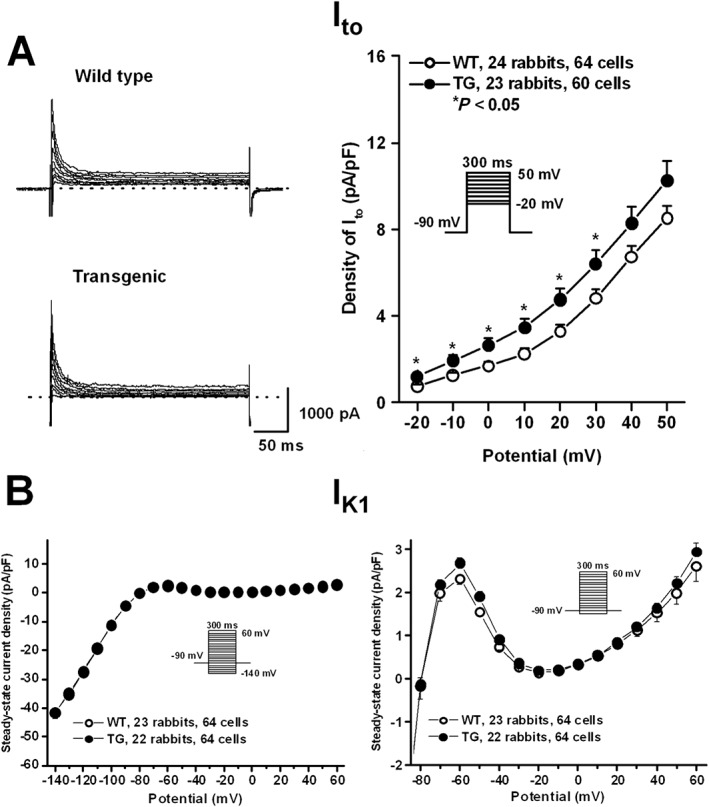
Figure 5.

The density of Ito (A) and IK1 (B) in rabbit ventricular myocytes. Representative Ito current traces recorded from wild‐type (WT) and transgenic (TG) ventricular myocytes are shown in panel A (left). Current–voltage relations (right) demonstrate higher Ito density in TG rabbits compared with WT rabbits. Panel (B) illustrates steady‐state current–voltage curves (left) demonstrating no differences in density of IK1 between WT and TG rabbits. The outward current sections of the curves are enlarged on the right. Insets show the applied voltage protocols. Values are means ± SEM. * P < 0.05 versus WT littermates.
