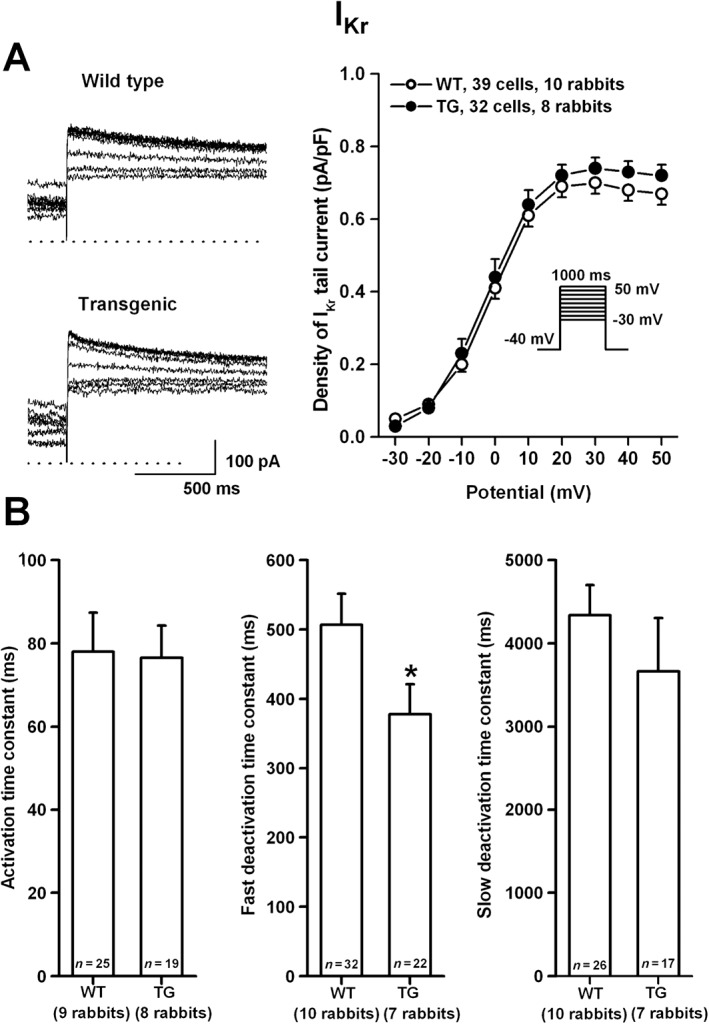
Figure 6.

The density of IKr (A) in rabbit ventricular myocytes. Representative IKr tail current traces recorded from wild‐type (WT) and transgenic (TG) ventricular myocytes are shown on the left. Current–voltage relations (right) demonstrate no differences in density of IKr between WT and TG rabbits. Inset shows the applied voltage protocol. Bar diagrams in panel (B) illustrate the activation and deactivation (fast and slow) time constants in WT and TG ventricular myocytes. Values are means ± SEM. * P < 0.05 versus WT littermates.
