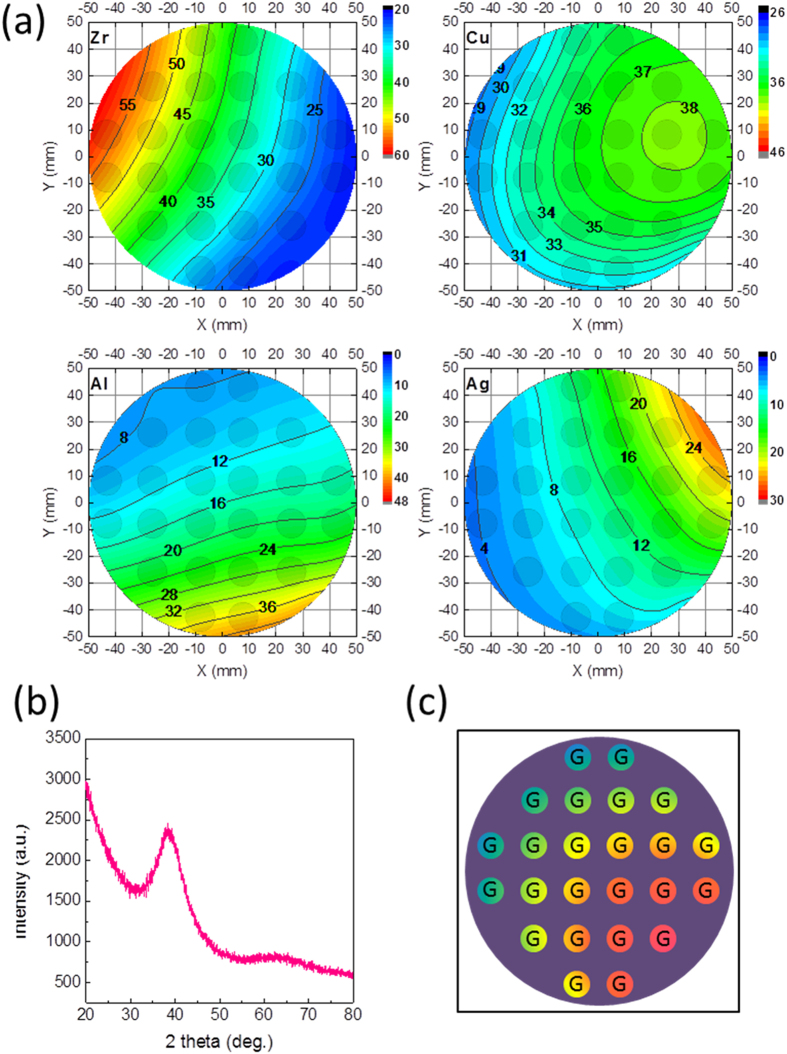
Figure 2. Compositional and structural characterizations of the materials library.
(a) Contour plots for the concentration of Zr, Cu, Al, Ag, respectively. Relative concentration of each element is indicated by the numbers in the plots, and physical positions of the patched alloys on Si substrate are labeled as circles. (b) A representative XRD spectrum for one alloy within the library. The lack of apparent crystalline Bragg peaks indicates that the film alloy is in glassy state. (c) Summary of structural characterizations by XRD on all of the alloys within the library. “G” means glass in the summary, indicating that all the alloys are in the glassy state, and the colors of the solid circles are schematic illustration of different compositions.

