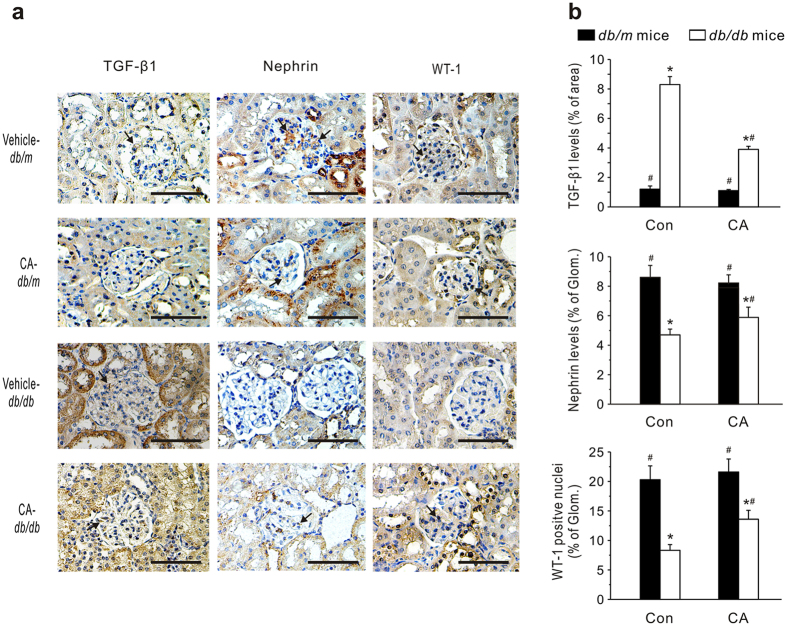
Figure 3. Effects of CA on glomerular TGF-β1, nephrin and Wilms’ tumor-1 (WT-1) levels in db/db mice.
(a) Representative immunohistochemical images. Scale bars: 100 μm. (b) Quantitative assessments of immunohistochemical staining in the kidneys. Twenty glomeruli were randomly selected from four kidneys in each group. Data are presented as mean ± SEM *P < 0.05 vs. vehicle-treated db/m mice; #P < 0.05 vs. vehicle-treated db/db mice.

