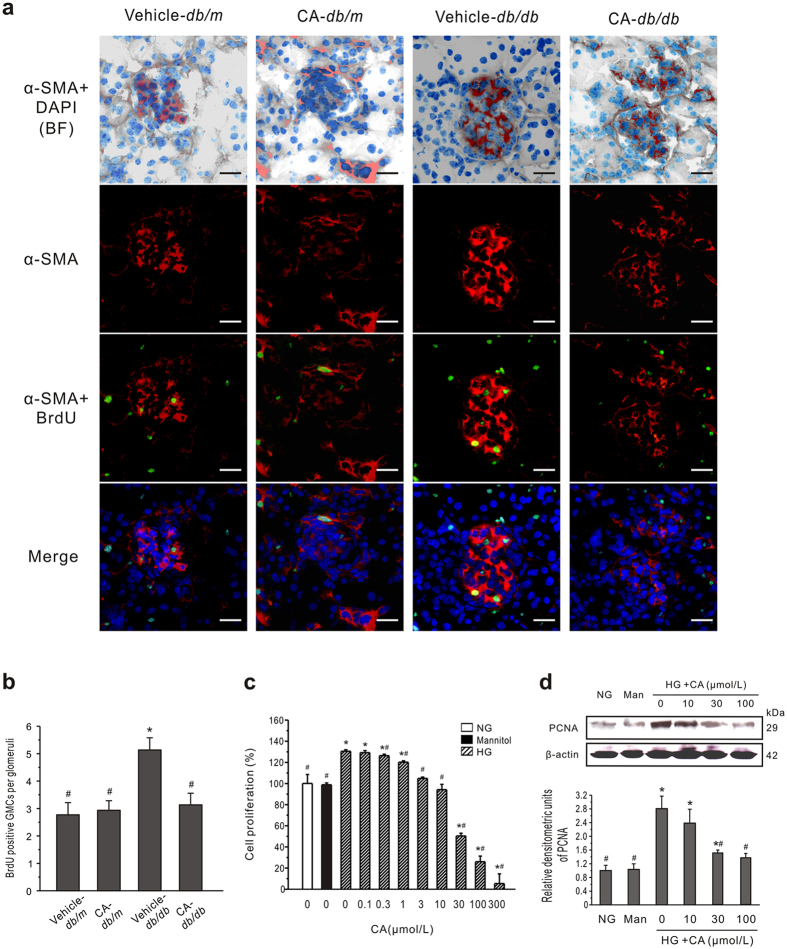
Figure 4. CA inhibits the GMCs proliferation both in vivo and in vitro.
(a) Confocal findings in kidney tissue. Nuclear BrdU incorporation shows relative proliferation of GMCs in db/db mice. Green, BrdU positive nuclei; red, α-SMA (showing GMCs); blue, DAPI; BF, bright field. Scale bars: 50 μm. (b) Quantitation of BrdU positive nuclei in α-SMA-positive segments in each glomeruli. Cells were identified as proliferating mesangial cells if they showed positive nuclear staining for BrdU and if the nucleus was completely surrounded by cytoplasm positive for α-SMA. Data are presented as mean ± SEM (n = 30). *P < 0.05 vs. vehicle-treated db/m mice; #P < 0.05 vs. vehicle-treated db/db mice. (c) Growth-inhibitory effects of CA on GMCs were measured by MTT assay. Mannitol (19.5 mmol/L, Man) was used as an osmotic control. The assay was done with six replicates and repeated three times. (d) Western blot analysis of PCNA expression in cultured GMCs treated with NG or HG plus CA for 24 h. Typical results are depicted in upper panel along with statistical analysis of PCNA to β-actin expression in lower panel (n = 3). *P < 0.05 vs. NG control; #P < 0.05 vs. HG control.

