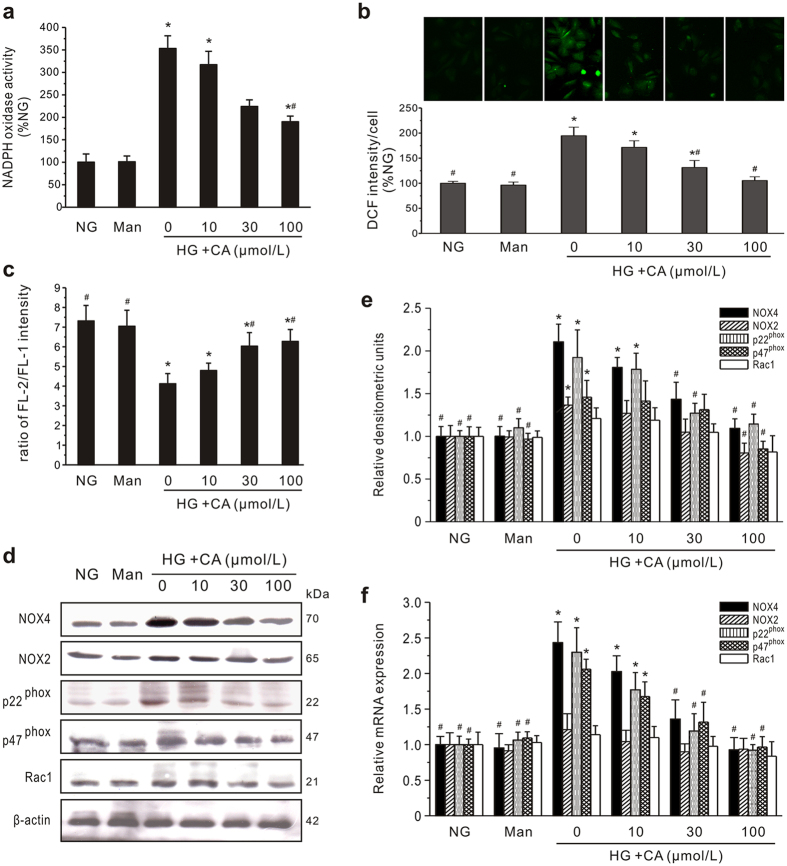
Figure 7. Effects of CA on NADPH oxidase activation, ROS generation, mitochondria membrane potential (Δψm) and expression of isoforms and subunits of NADPH oxidase in GMCs.
(a) NADPH oxidase activity. Cultured GMCs treated with normal glucose (NG) or high glucose (HG) for 24 h. Mannitol (19.5 mmol/L, Man) was used as an osmotic control. After pretreatment of CA at different concentrations (10, 30, and 100 μmol/L) for 24 h, NADPH oxidase activity was measured. The data were normalized to control cells. (b) Intracellular ROS production. GMCs treated with NG or HG plus CA for 24 h. Cells were stained with ROS-sensitive dye DCF-DA for 60 min at 37 °C, then observed under a fluorescence microscope (upper panel). All data were normalized to control cells (lower panel). (c) Effect of CA on Δψm. GMCs were stimulated with HG plus CA for 24 h, and Δψm was measured by JC-1 labeling with flow cytometry (n = 4). (d–f) Protein and mRNA expression of NADPH isoforms and NOX-associated subunits. GMCs treated with NG or HG plus CA for 24 h. Expression of proteins including NOX4, NOX2, p22phox, p47phox and Rac1 was detected by western blot analysis. Representative western blots (d) and statistical analysis (e) of each protein’s expression relative to β-actin are showed. Relative amounts of mRNA (f) were determined by real-time PCR using 18S as an endogenous control. The experiments were repeated three times. *P < 0.05 vs. NG control; #P < 0.05 vs. HG control.

