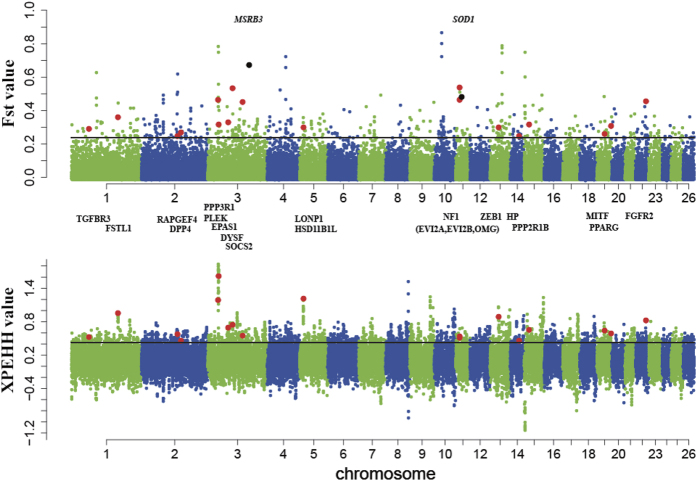
Figure 2. Genome-wide distribution of FST and XP-EHH values.
Red dots represent sites showing significant signals in both the FST and XP-EHH approaches; black dots represent sites showing significant signal in the FST approach only. The symbols for candidate genes for adaptation to high-altitude hypoxia in the map are shown in bold and italics.

