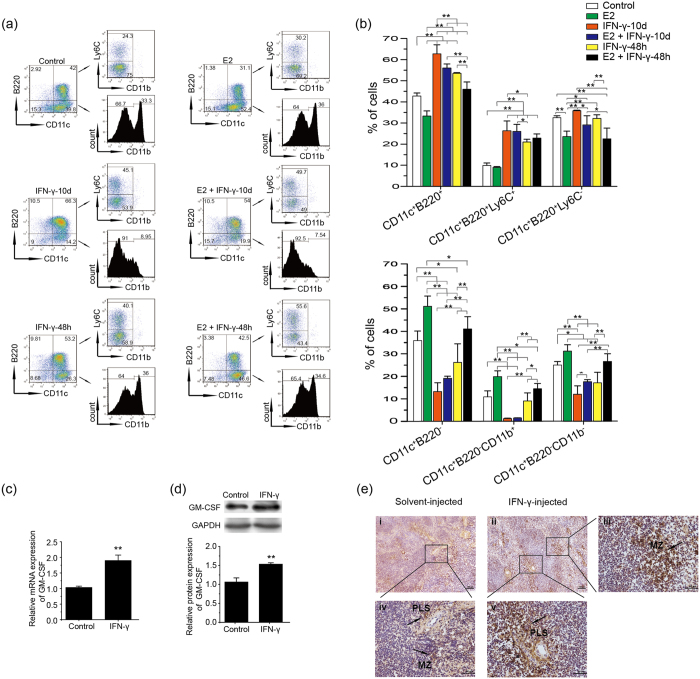
Figure 5. IFN-γ elevates GM-CSF to disrupt the balance between cDCs and pDCs.
(a) Total BMs from female C57BL/6 mice were cultured in hormone-deficient medium with 100 ng/ml Flt3L with different treatments (10 nM E2; 300 U/ml IFN-γ). E2 was added at the starting point of the culture with all treatments. IFN-γ was added on D0 or last 48 h during the culture, respectively, and the cells were collected for analysis on D10. The percentages of cDCs (CD11c+ B220−), mDCs (CD11c+ B220− CD11b+), LDCs (CD11c+ B220− CD11b− to lo), pDCs (CD11c+ B220+), functional pDCs (CD11c+ B220+ Ly6C+) and unknown-function pDCs (CD11c+ B220+ Ly6C−) are shown for different treatments. (b) The histogram displays the statistical results of three independently repeated experiments. represent the mean ± SD. *P < 0.05; **P < 0.01. (c,d) GM-CSF expression of spleen cells was analyzed by quantitative PCR (c) and Western blotting (d) in three independently repeated experiments. The data represents mean ± SD. *P < 0.05; **P < 0.01. (e) GM-CSF expression in the spleen was analyzed by immunohistochemistry. Positive staining cells are indicated by arrows in the PLS and MZ of the spleens. Photomicrographs are representative of four mice in the control and IFN-γ-treated groups. Panels iii, iv and v are higher magnifications of black rectangle-marked areas. Scale bars: 100 μm (i and ii) and 50 μm (iii, iv and v).

