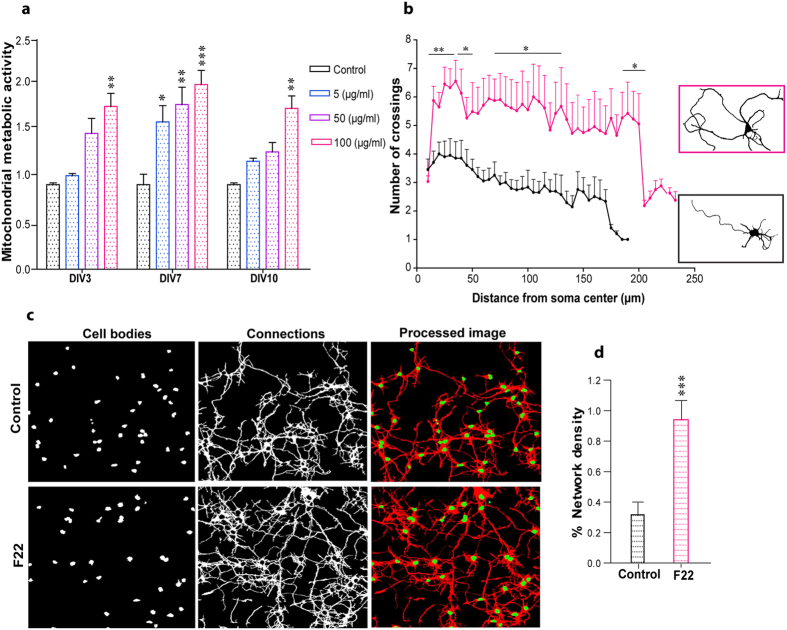
Figure 2. Effect of F22 on neuronal activity and network formation.
(a) Mitochondrial metabolic activity of cortical neurons treated with different concentrations of F22 was measured at 3, 7 and 10 DIV. One-way ANOVA followed by the Bonferroni post-hoc test (*p < 0.05, **p < 0.01, ***p < 0.001; n = 17 samples from 3 independent experiments; * vs control). (b) Sholl analysis of cortical neurons treated with F22 at 100 μg/ml for 3 days compared to non-treated control cultures. Right: representative images of a single neuron under control conditions (black frame) and after treatment with F22 (pink frame). Two-way analysis of variance (ANOVA) followed by Tukey’s multiple comparison tests. (*p < 0.05, **p < 0.01; n = 25 to 30 cells from 3 independent experiments) (c,d) Network formation analysis in cortical cultures after treatment with F22 at 100 μg/ml for 3 days and under control conditions. Different channels for cell bodies, connections and processed images are represented. Student’s t-test, *p < 0.05, **p < 0.01, ***p < 0.001 (n = 80 images for each condition from 4 independent experiments).

