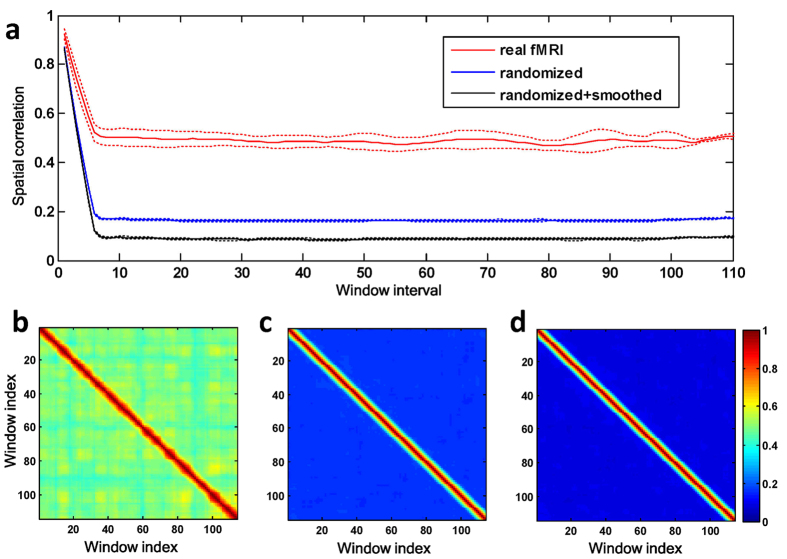
Figure 5. Temporal characteristics of ReHo fluctuation from a typical subject.
(a) The spatial correlation between ReHo maps of two windows as a function of the window interval. Here, the window interval was defined as the absolute difference between the indexes of the two windows. The spatial correlation is averaged across all pairs of windows that have the same interval. Dashed lines indicate the standard deviation across window-pairs having the same intervals. Similarity matrices showed the spatial correlation between ReHo maps of any pair of windows in real fMRI data (b), randomized data (c), and randomized + smoothed data (d), respectively.

