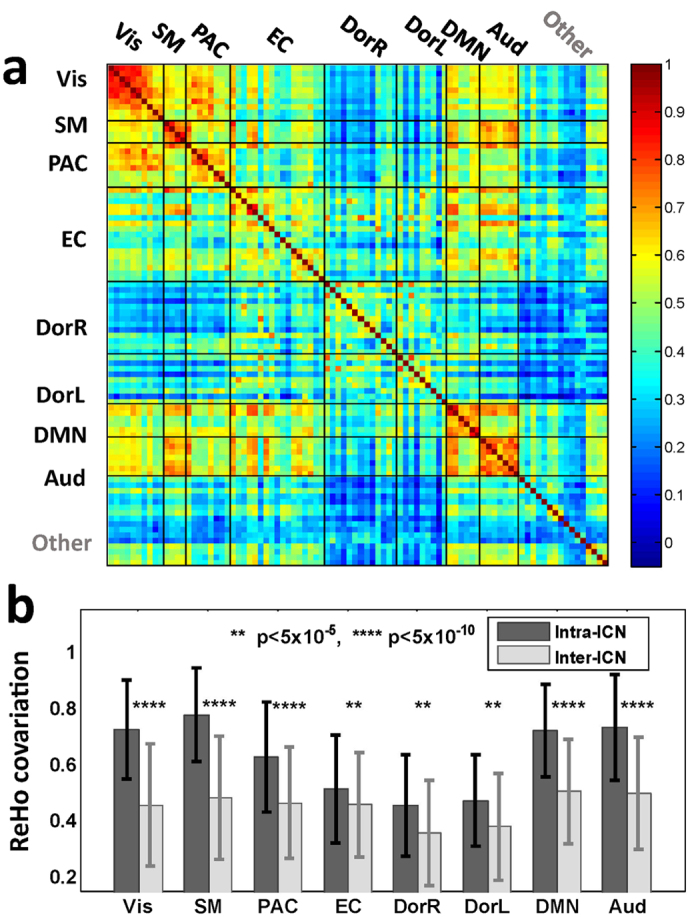
Figure 6. Temporal covariation of ReHo between ROIs.

(a) ReHo covariation between ROIs defined by AAL template. Each entry in the matrix represents the covariation of ReHo between a pair of ROIs, as measured by Pearson’s correlation coefficient averaged across subjects. (b) Intra-ICN and inter-ICN ReHo covariation of all the ICNs. Error bars indicate standard deviation across subjects.
