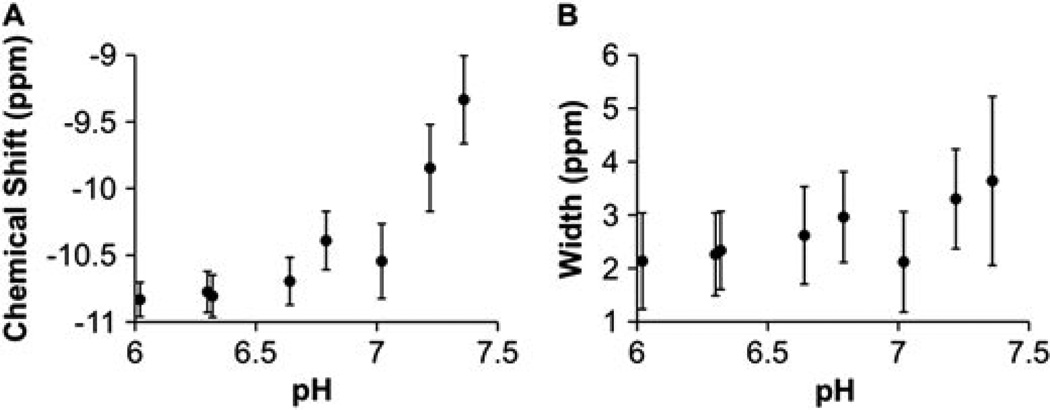
Figure 10.
The dependence of CEST characteristics on pH. (A) The chemical shift of the CEST effect of the amide approached the chemical shift of water (defined as 0 ppm) as the pH was increased. (B) The width of the CEST effect of the amide increased as the pH was increased. Both of these characteristics indicate MR coalescence as the pH is increased. Error bars represent the standard deviation of nine repetitions, and these results were acquired at 38.3 °C. The chemical shift and width above pH 7.5 for the CEST effect of the amide, and the chemical shift and width at all pH values for the CEST effect of the amine, were limited by constraints imposed in the Lorentzian line fitting routine, so these results that may be affected by the fitting algorithm are not shown.

