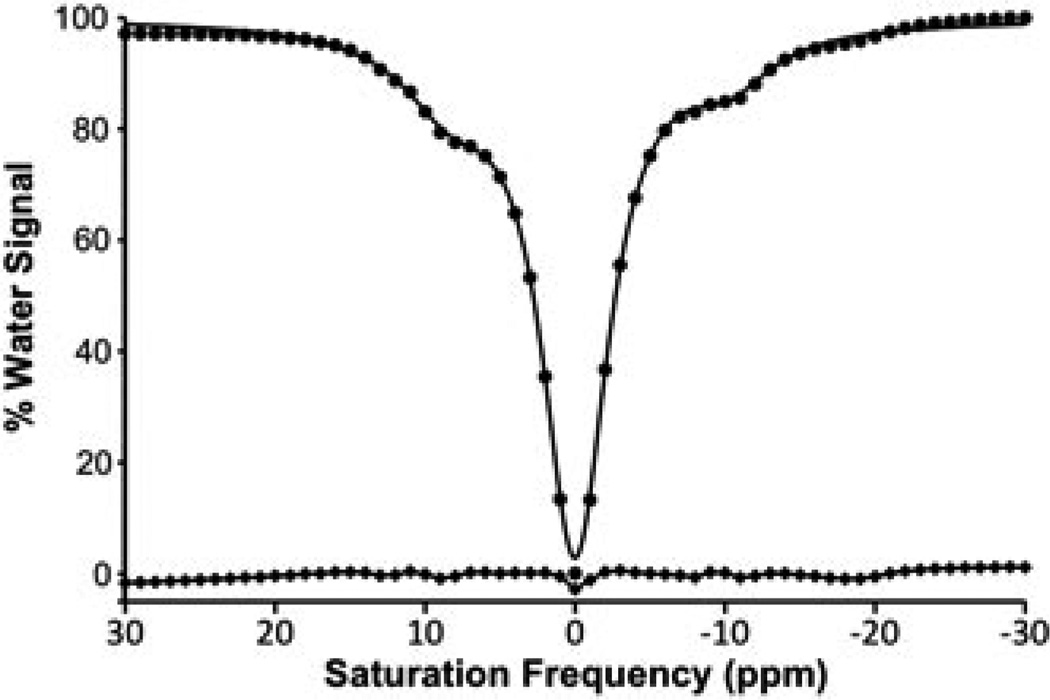
Figure 2.
CEST spectrum of Yb–DO3A–oAA. A CEST spectrum of 30mm Yb–DO3A–oAA at pH 7.3 and 38.3°C was acquired with 6 µT selective saturation for 4 s with a 1 ppm bandwidth in 1 ppm increments. The CEST spectrum (circles) was fitted with a single function that consisted of a sum of three Lorentzian lines (thick line). The difference between the experimental data and the fitted function (squares connected by a thin line) shows the residual errors of the line fitting process.

