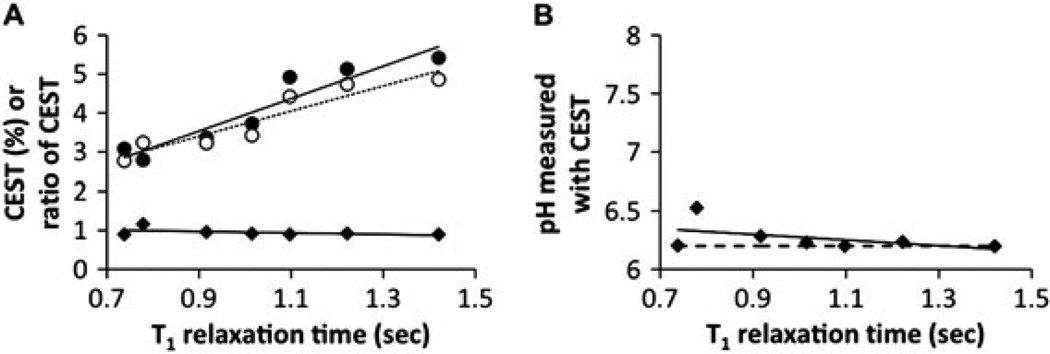
Figure 7.
The dependence of CEST on T1 relaxation time. (A) The percentage CEST effects of the amide (solid circles) and amine (open circles) of 30 mm of Yb–DO3A–oAA were measured at pH 7.20 and 37 °C using 10 µT saturation power. Samples were doped with Gd-DTPA to modify the T1 relaxation time. Although each CEST effect was dependent on T1, the ratio of the CEST effects were relatively independent of T1. (B) The pH values measured from the CEST effects of Yb–DO3A–oAA were independent of T1. The dashed line represents the pH measured with an electrode.

