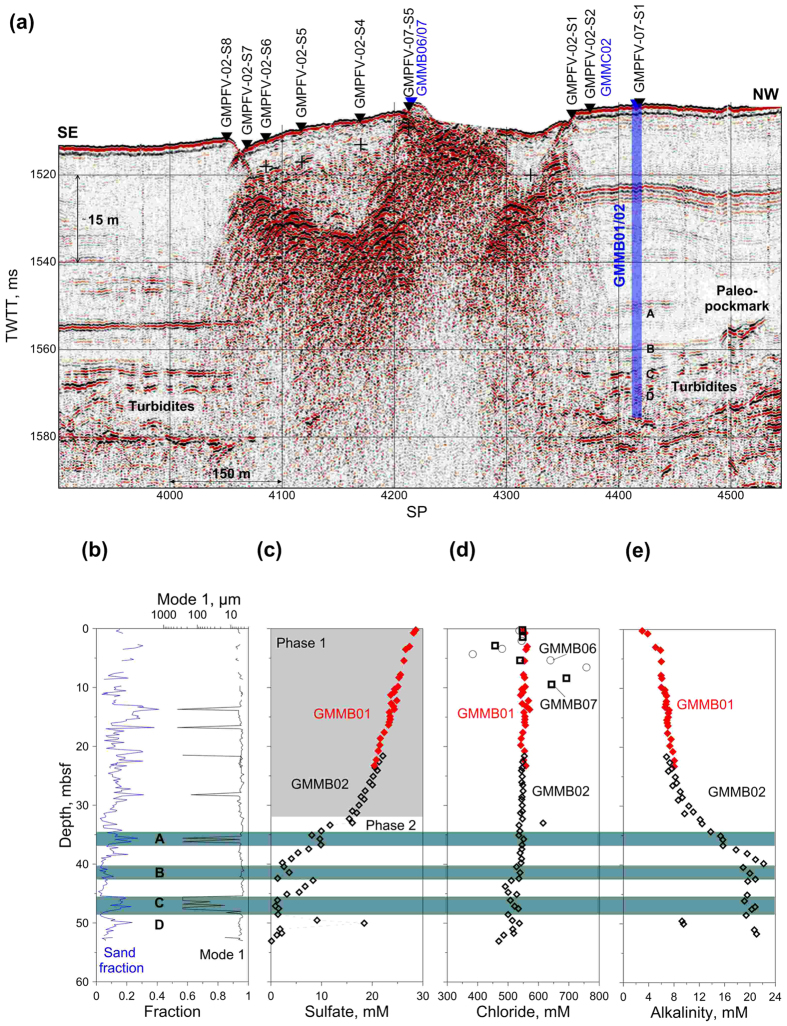
Figure 2. Geophysical, geochemical and sedimentological data.
(a) Seismic profiles SY01-HR-PR01 showing a significant contrast between high-amplitude chaotic facies at the center of the pockmark and low-amplitude subparallel reflectors of surrounding sediments. Four MeBo drill sites, 1 Calypso core and 9 in-situ Penfeld celerimeter measurements were used to define the top of the gas hydrates (black dash line and black crosses) as indicated on the seismic line. Level A corresponds to the presence of carbonate foraminifera while levels B, C and D correspond to high amplitude turbidite layers. A paleo-pockmark overlaying these turbidite layers is also indicated in (a). (b) Sand fraction and grain size distribution mode 122 as a function of depth obtained from drill sites GMMB01 and GMMB02 showing that levels A, B, C and D correspond to high sand (or sand-like for layer A) fractions. (c) Concentration of sulfate in pore water from GMMB01 (red diamonds) and GMMB02 (black diamonds). The sulfate profile in (c) appears to result from two different methane advection-diffusion phases (phase 1 and phase 2). (d) Concentration of chloride in pore water from GMMB01, GMMB02, GMMB06 and GMMB07 and (e) alkalinity in pore water from GMMB01 and GMMB02.

