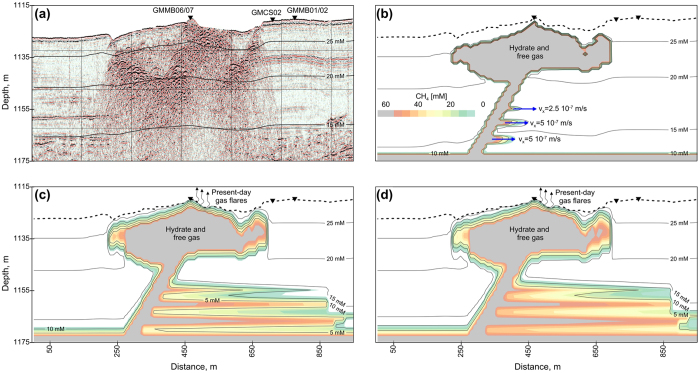
Figure 5. 2D modeling of sulfate-reduction coupled to AOM.
In panels (b–d), the color scale corresponds to methane concentrations, while the contour lines indicate dissolved sulfate concentrations. Panel (a) corresponds to the final stage of phase 1 while the three other panels correspond to (b) 2.5 years, (c) 80 years and (d) 130 years of methane and sulfate evolution after the initiation of lateral advection of methane (blue arrows in (b). Present-day gas flares indicated in panels (c) and (d) were detected by the vessel multibeam echosounder15.

