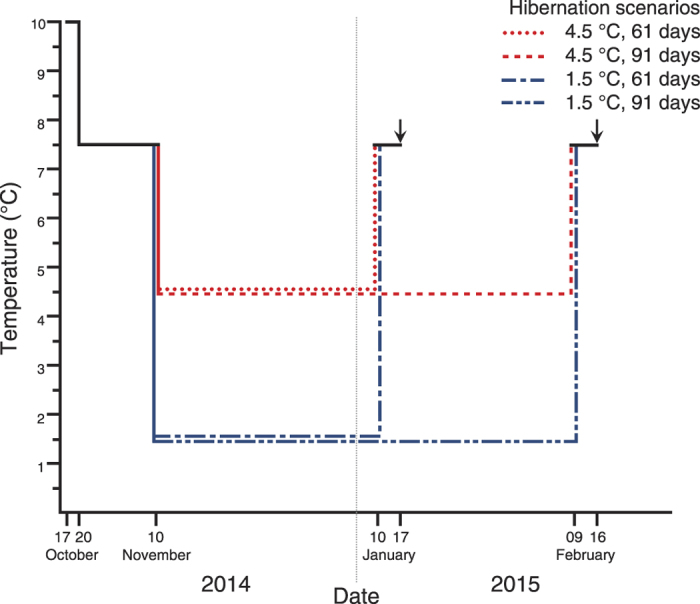
Figure 1. Schematic representation of the experimental procedures.

Arrows denote the dates of weighing after hibernation. Temperature clines during the hibernation period are misaligned to allow visibility.

Arrows denote the dates of weighing after hibernation. Temperature clines during the hibernation period are misaligned to allow visibility.