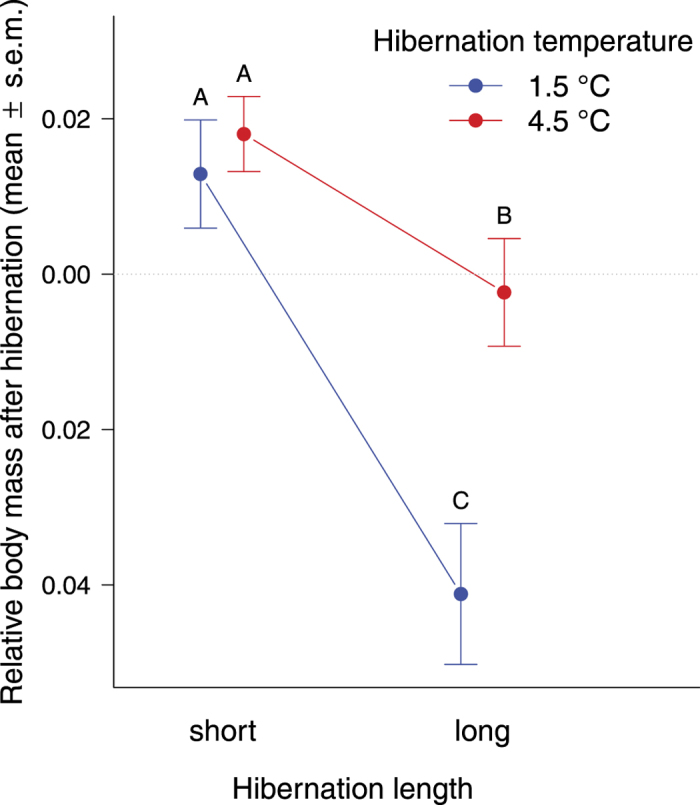
Figure 3. Body mass of toadlets relative to their pre-hibernation mass, one week after hibernation.

The ‘Y’ axis represents residuals of a linear mixed-effects model consisting of body mass after hibernation as the dependent variable, body mass before hibernation as a covariate, and family crossed with enclosure as random factors. Mean ± s.e.m. values are shown (N = 325). Letters above error bars represent pairwise comparisons; groups marked with different letters differ significantly based on linear contrasts corrected for false discovery rate.
