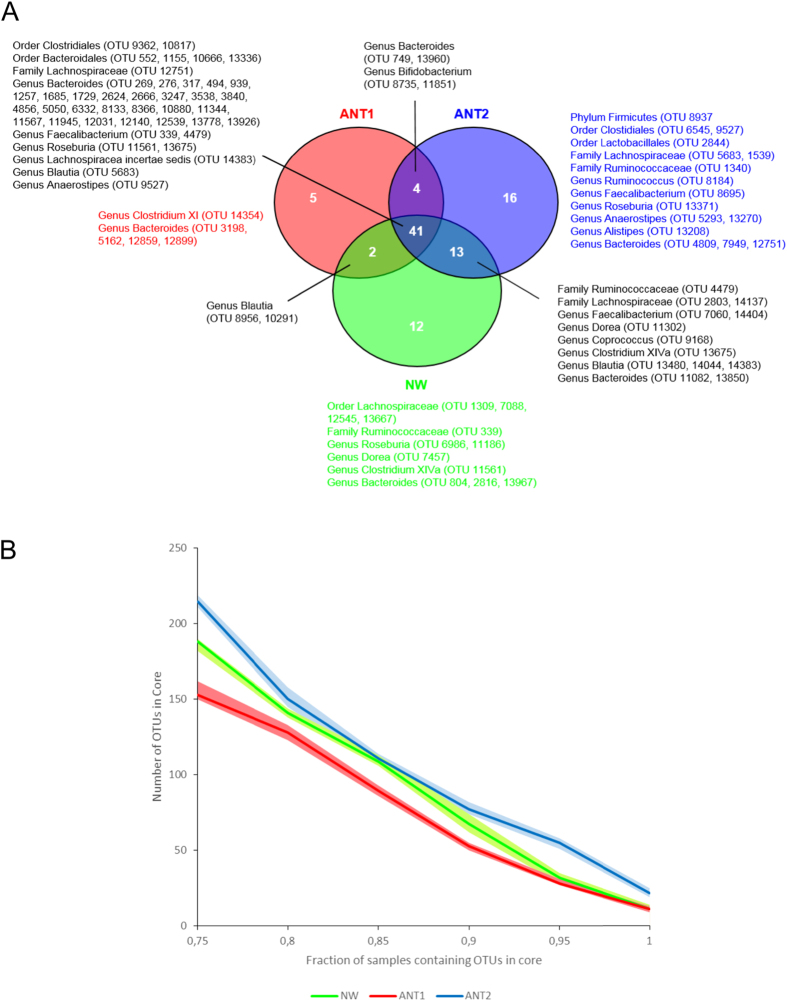
Figure 4. The core microbiome of anorexia nervosa patients (AN) before (T1) and after (T2) weight gain compared to normal-weight participants (NW).
(A) The Venn diagram shows the core microbiome of AN at T1 and T2 and of NW. For each of the groups the core microbiome was defined as the OTUs that were observed in at least 90% of the participants. Bacterial taxa belonging only to the core of ANT1, ANT2 or NW are listed in respectively red, blue and green. (B) The fraction of samples in the core microbiome of AN at T1 and T2 and of NW are presented. The number of OTUs part of the core microbiome defined as the OTUs that were observed in a minimal fraction of subjects ranging from 75% to 100%. Lines represent the mean number of OTUs in the core (based upon 10 rarefactions), surrounding areas represent the 95% confidence intervals.

